We at Gumlet handle more than a billion video requests per day. Serving these requests with the best performance is one of our top KPIs. Reducing latency in video serving can bring improvements in video startup times, seek time, and re-buffering times. All this put together can result in smooth playback of videos and elevate the customer experience.
We use Fastly as our primary CDN provider. Fastly uses the CUBIC congestion control algorithm by default. They, however, allow changing congestion control to reno, bbr or cubic using socket.congestion_algorithm parameter. We have long known thanks to Google that BBR is one of the promising algorithms, and we certainly wanted to try it.
Measurement Challenge
Fastly allows measuring total request time as well as TTFB but when it comes to measuring the efficacy of congestion control, latencies are best measured at the client end. However, we don't have any control of end-client code and we only give HLS streams to our customers who use different approaches to implement video playback. This ruled out any possibility of us using any Real User Monitoring (RUM) tools to measure the difference in performance.
We were looking for a way to measure end-user request times without pushing any of our custom code to end-clients. Fortunately, there is an in-built way in Chromium-based browsers (Chrome, Edge, and Opera) to track actual request performance.
NEL to Rescue
Network Error Logging is a mechanism that can be configured via the NEL HTTP response header. This header allows websites and applications to opt-in to receive reports about failed (and, if desired, successful) network fetches from supporting browsers.
There is also another header Report-To which takes the following syntax.
Report-To: { "group": "nel", "max_age": 31556952, "endpoints": [ { "url": "https://example.com/csp-reports" } ] }
A report submitted by NEL looks like this:
{
  "age": 20,
  "type": "network-error",
  "url": "https://example.com/previous-page",
  "body": {
    "elapsed_time": 338,
    "method": "POST",
    "phase": "application",
    "protocol": "http/1.1",
    "referrer": "https://example.com/previous-page",
    "sampling_fraction": 1,
    "server_ip": "137.205.28.66",
    "status_code": 400,
    "type": "http.error",
    "url": "https://example.com/bad-request"
  }
}We are interested in the field elapsed_time. This tracks the total time passed (in milliseconds) from the start of request to the end of last byte received. The best part about NEL logging is that it can be configured to receive a report on all or a fraction of successful responses by putting a success_fraction parameter in the NEL header. We configured our final NEL header to forward 1% of all successful response reports.
{"report_to": "gumlet-nel", "max_age": 604800, "success_fraction": 0.01}
We are now getting (1% of) real-world data about how much time it took for successful requests to complete.
Flipping the Switch
We rolled BBR to a small set of customers in Feb 2022 before finally switching everyone. On 1st March 2022, at 7 AM UTC, we decided to flip the switch and deploy BBR for all of our customers.
The data measured over the last 3 days shows definite improvements in response time for the best connections as well as the poor connections.
Best Connections
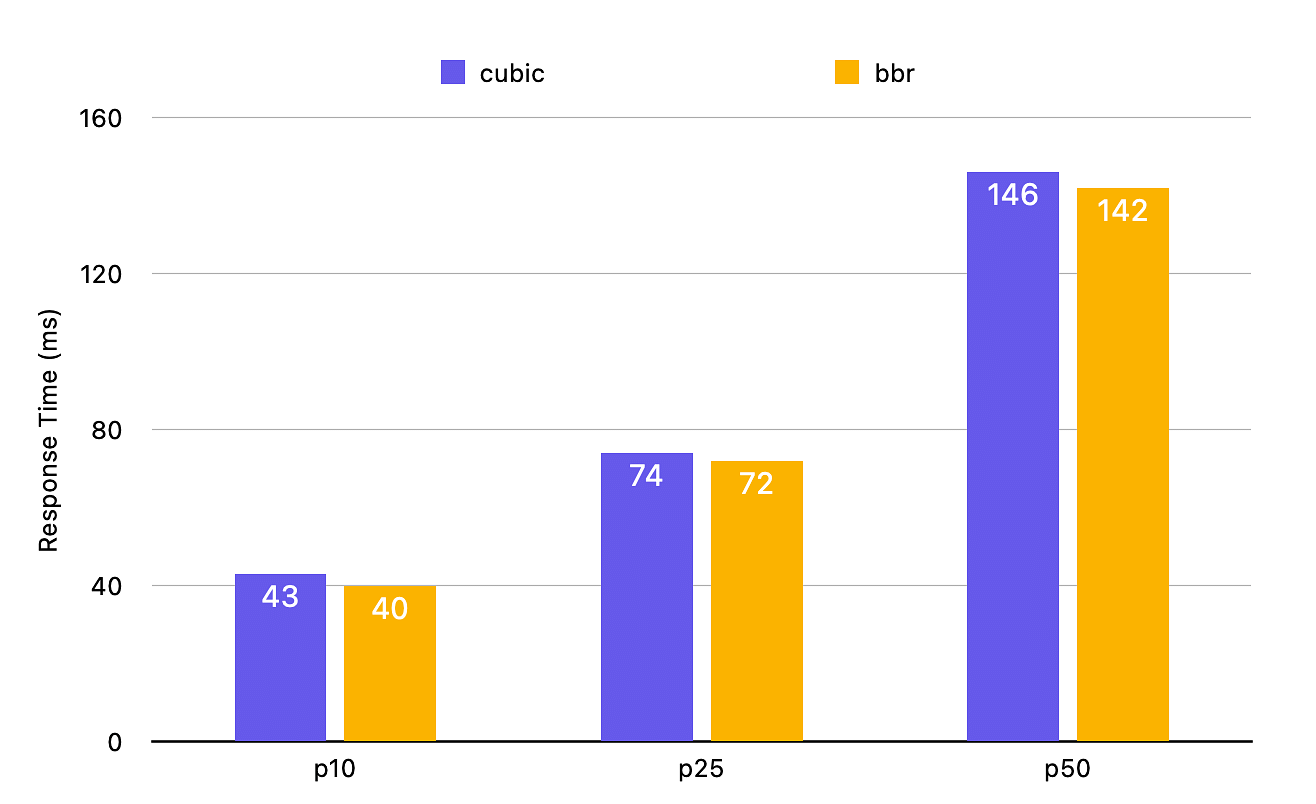
We have taken p10, p25, and p50 response times to measure the best connections. We are seeing between 2-6% improvements in response times. Since the response times with CUBIC are also quick, we don't see massive benefits here but there are measurable differences.

Poor Connections
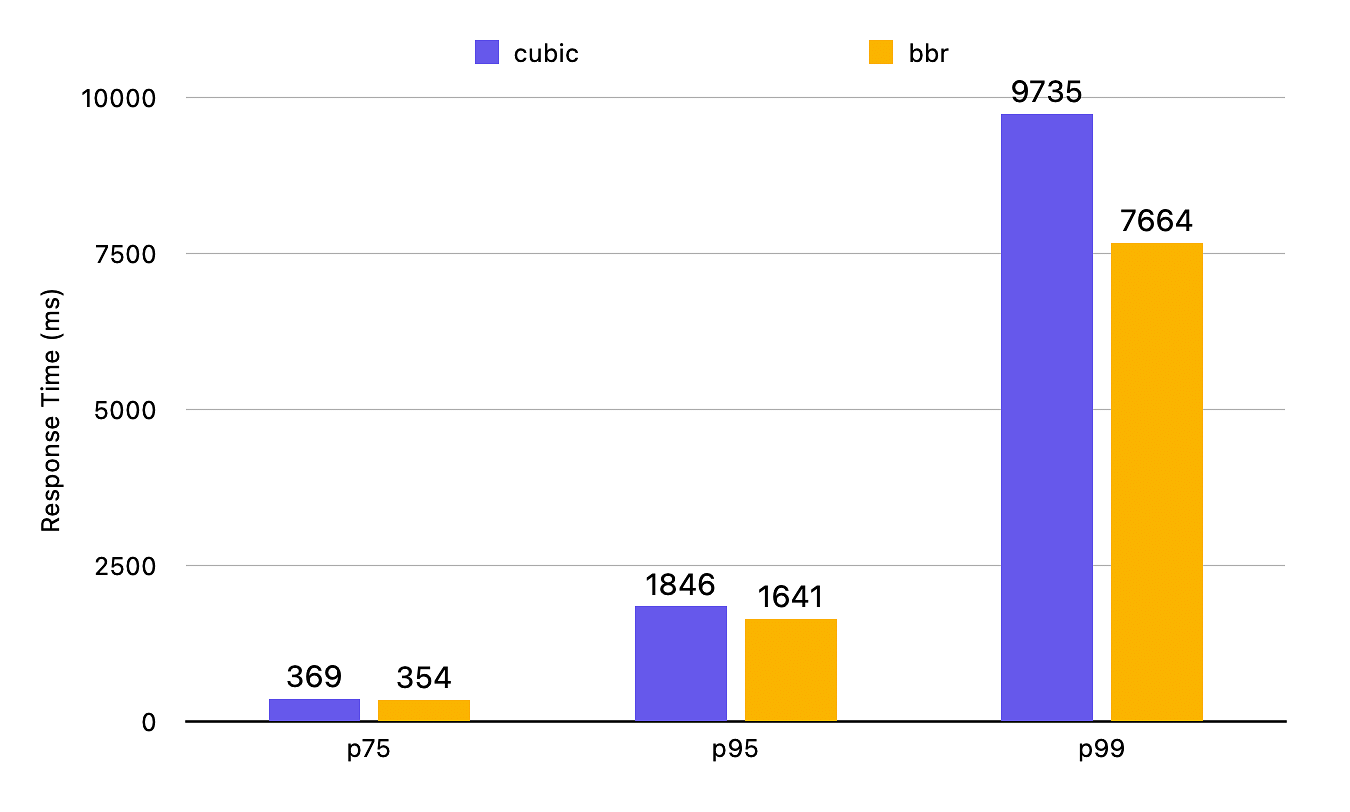
We have taken p75, p95, and p99 response times to measure the impact on poor connections. It shows that the impact of BBR is highest in such lossy connections, and it results in a very significant performance improvement. For p75, response times are 4% better, but for p95 and p99, response times are reduced by 9.4% and 21%.
This is a huge win for customers on lossy connections. They are now getting their videos started around 2 seconds faster, and similar improvements are seen in seek times.

Caveats and Future Work
BBR works fine for most networks, but there are some known limitations. This APNIC blog describes how deploying it at a large CDN gave mixed results with different network providers.
When we analyzed our data, we also found the same. There are some ASN for which the response times increased after switching to BBR. Fortunately, the number of ASN for which this happened is minimal, and Fastly also allows selectively switching to BBR based on ASN. We are now excluding some of those ASN from BBR deployment to ensure the best performance for everyone.
We will continue to monitor our deployment for the coming weeks and make necessary changes as needed. We also want to improve upon our ability to track response times and actual user performance impact across a wide range of devices and platforms and not only chromimum-based browsers.
Our newly launched product Gumlet Insights is built to measure real-world performance for videos. We will continue to spread our net wider with that product and soon share even better benchmarks on how end-user performance improved with this rollout.


