
A buffering spinner has never convinced anyone to sign up for a trial.
Teams pour weeks of effort into onboarding tours, product demos, and explainer videos, then judge success on view counts and likes.
Meanwhile, users hit slow starts, stalls, or blurry playback at the exact moment they are deciding whether to sign up, activate a feature, or upgrade.
If video sits inside your product tours, help center, or sales process, those glitches are not just UX annoyances. They quietly drag down trial activation, feature adoption, demo-to-opportunity rates, and revenue, while topline metrics still look “fine”. The only way to see what is really happening is to treat video performance as three connected layers that mirror your funnel: whether users can watch at all, whether they stay long enough to reach the value moment, and whether that viewing session actually changes what they do next.
In this article, we will use a simple structure to keep that connection tight: Deliver, Engage, Convert.
- Deliver: looks at playback quality and reliability on real devices and networks.
- Engage: focuses on whether viewers reach the specific timestamps that explain your product and unblock the next step.
- Convert: ties clean viewing sessions to activation events, signups, upgrades, and long-term value, so you can stop guessing whether a video “works” and start measuring its impact.
We will walk through the metrics that matter in each layer, how playback quality affects activation and conversion on key pages and in demos, and how to plug video data into your existing analytics stack without turning it into a separate reporting universe. Along the way, you will see where a specialized platform helps when you need infrastructure-grade delivery and analytics that speak in the language of growth, not just views.
Instead of guessing whether your videos are helping or hurting activation and conversion, you can plug real playback, engagement, and outcome metrics into your stack from day one.
Explore Gumlet’s Video Analytics hub to see how playback quality, viewer behavior, and business results come together in one place and start building cleaner, faster, higher-converting video journeys.
Three Metrics to Understand Video Performance
To keep video performance tied to growth, it helps to group metrics into three layers:
- Deliver: Can users actually watch the video without friction?
- Engage: Do they stay long enough to reach the value moment?
- Convert: Does that viewing session lead to activation or revenue?
Everything else hangs off these three questions.
1. Deliver: Can Users Watch Videos Smoothly?
Deliver metrics that cover playback quality and reliability. If this layer breaks, nothing else matters.
Focus on:
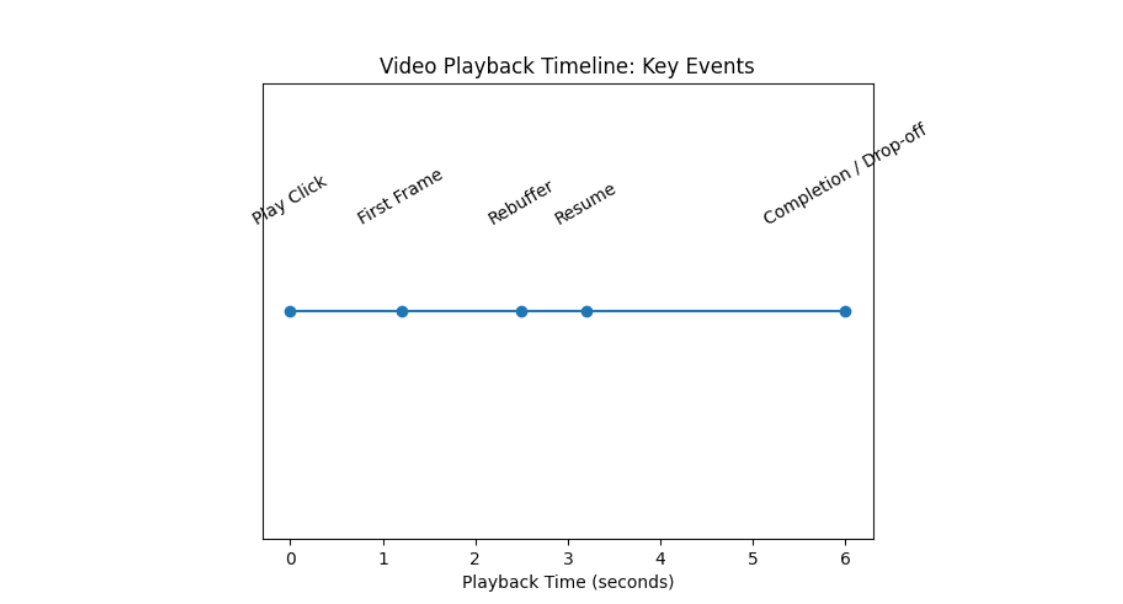
- Startup Time (Time-to-first-frame): How long does it take from click to playback? A longer startup means more early abandonment, especially on mobile.
- Rebuffering and Stalls: How often does playback pause, and how much time is spent buffering? A few short stalls can kill a product tour.
- Playback Errors: Failed attempts due to network, format, or security issues. Users in this bucket never see the message.
- Quality Adaptation: Bitrate and resolution delivered to users by device, network, and region.
Treat these as your quality-of-experience baseline. If startup, buffering, or errors are bad, fix the infrastructure before judging content.
2. Engage: Do Viewers Reach The Value Moment?
Once playback is smooth, the next question is how people watch.
Key Engage metrics:
- Play Rate: Visitors who start the video. This reflects thumbnail, copy, and placement.
- Completion to Key Timestamp: Percentage of viewers who reach the moment where you show the core value or next step, not just the end of the video.
- Watch Pattern: Where people drop off, skim, or rewatch. Heatmaps and attention graphs highlight slow intros and confusing segments.
- In-player Actions: Click on CTA's, chapters, forms, or links inside the player.
Here, the goal is simple- ensure users actually reach and understand the part of the video that unblocks activation or a decision.
3. Convert: Do Viewing Sessions Change Outcomes?
Convert metrics connect viewing to business results.
For SaaS and PLG (Product-led Growth), focus on:
- Activation After View: Share of viewers who complete a defined activation event within a time window after watching (for example, first project, first integration, first course published).
- Conversion After View: Share of viewers who start a trial, book a demo, upgrade, or purchase after watching a key video.
- Converted Viewers vs. Non-viewers: Difference in activation or conversion between users who watched to a certain point and a similar group who did not.
- Downstream Value: Revenue, expansion, or retention differences between accounts whose key users consumed specific videos and those that did not.
These require session-level linkage between playback events and product, analytics, or CRM events. Without that, video performance stays in a silo of vanity metrics.
Concise View of The Three Layers
If you want a quick diagnostic, this simple grid is usually enough:
| Layer | Example metrics | Core question |
|---|---|---|
| Deliver | Startup time, buffering ratio, error rate, quality by device or region | Can users actually watch comfortably |
| Engage | Play rate, completion to key timestamp, watch pattern, in-player actions | Do viewers reach and interact with the value moment |
| Convert | Activation after view, conversion after view, converted viewers vs. non viewers, downstream revenue | Does watching this video change outcomes |
- If the delivery is weak, then fix the playback.
- If Deliver is fine but Engage is weak, fix the structure and UX.
- If both are fine, but Convert is weak, fix positioning, CTAs, and how the video connects to the rest of the funnel.
How Playback Quality Impacts Activation in Product-led SaaS
In a product-led funnel, activation is not “user signed up”. Activation is the moment a user experiences real value in the product for the first time. Playback quality decides whether your videos help users reach that moment or quietly block them.
What Activation Actually Means
In PLG and SaaS, activation is usually defined as one clear, observable action that strongly predicts retention. For example:
- Analytics or Design Tool
- Activation event: User creates and saves a first project or report.
- EdTech or Course Platform
- Activation event: Learner completes the first lesson or quiz.
- Collaboration or documentation tool
- Activation event: User invites a team member and collaborates on one document.
- Video infrastructure or media product
- Activation event: First video uploaded, processed, and embedded or shared.
Most teams already have a rough activation definition in their product analytics. The question here is how video playback quality helps or blocks users from getting there.
Where Videos Sit in The Activation Journey
Activation videos mostly show up in three places:
- In-product onboarding: Short tours and walkthroughs that show how to perform the first key action in the app.
- Feature and “aha moment” explainers: Slightly longer clips that explain what makes the product different and why a feature matters.
- Help center and unblocker content: “How to” videos that remove friction when users get stuck on a specific step.
A simple way to map this:
| Activation context | Typical video type | Role in activation | What poor playback does |
|---|---|---|---|
| First time onboarding | 30 to 90 second product tour | Shows how to complete the first core action | Users skip the tour, click around blindly, then churn |
| Deep feature discovery | 2 to 5-minute feature walkthrough | Connects advanced features to real use-cases | Power features never get used, trials look inactive |
| Help and support | Task-specific “how-to” video | Unblocks confused users at critical steps | Users abandon the task or raise tickets instead |
| Customer success and training | Playlist or course-style content | Turns basic users into power users and advocates | Training completion drops, expansion stalls |
In all of these cases, users are usually already somewhat invested. They have signed up, clicked into a feature, or opened a help article. A buffering spinner at this point is not a minor annoyance; it is a direct barrier to the user's first value moment.
Metrics That Matter For Activation-focused Videos
For activation, you do not need a long list of KPIs. You need a clean line from playback quality to activation events.
On the performance side, for key onboarding and feature videos, it is sensible to track:
Startup time on real user networks
Research suggests that if videos in onboarding or core help flows take more than about 2 seconds to start for a large share of users, you should treat that as a priority defect, especially on mobile.
Rebuffering ratio for activation videos
Even if your global rebuffering looks fine, focus specifically on videos that sit next to activation events. A small number of stalls at the wrong moment can have an outsized impact.
Error rate on activation paths
Track failed playback attempts specifically on screens tied to activation. Any non-trivial error rate here means some users never see the guidance they need.
On the behavior side, instead of average watch time, focus on:
- Completion of the “activation clue” timestamp: Identify the moment in the video where you clearly show how to perform the activation action. Track what percentage of viewers reach that point.
- Activation within a time window after view: For example, the percentage of viewers who complete the activation event within 1 hour or 24 hours of reaching that key timestamp.
When you link these pieces, you can answer precise questions, such as:
- Users who reach 75 percent of the onboarding tour activate at 28 percent, compared to 12 percent for those who never start it.
- Users who hit buffering three or more times during the feature tour are 40 percent less likely to use that feature in the next week.
- Users who successfully watch a specific help video are less likely to contact support and more likely to complete the task.
You do not have to chase perfect numbers across the entire product. The practical move is to identify 3 to 5 videos closest to activation, improve their playback quality to a healthy range, and make sure you are tracking activation events against viewing behavior.
Does Buffering Really Hurt Activation and Conversions
In theory, a motivated user might endure a few seconds of delay or a couple of stalls. In practice, most users treat poor playback as a signal that something is broken or not worth the effort, especially in early sessions.
What usually happens when activation videos buffer or fail is:
- New users assume the product is slow or unreliable, not just the video.
- They skip the guide and “figure it out later”, then never come back.
- Sales prospects seeing a demo recording interpret glitches as a reflection of the underlying product.
You rarely see explicit complaints about this. Instead, you see softer patterns:
- High signup numbers but weak activation rates.
- Plenty of traffic to “help” articles, but low task completion.
- Demo recordings that are opened but not watched beyond the first few seconds.
Treat buffering and slow playback on activation-related content as a direct activation risk. When you fix the infrastructure side for a small set of critical videos and track activation lifts carefully, it becomes much easier to justify further investment in video performance, because you are no longer arguing about aesthetics but about measurable product and revenue outcomes.
How Playback Quality Affects Conversion on Key Pages and Demos
Once users are past the signup or first-touch stage, video often sits right next to a commercial decision. At that point, playback quality affects conversion as directly as copy, pricing, or sales follow-up.
Landing Pages and Campaign Funnels
On paid and SEO landing pages, the typical goal of a product video is to increase form fills, trial starts, or demo requests, not to maximize views.
Playback quality influences conversion here in three main ways:
- Play Rate: If the thumbnail never loads properly or the page feels heavy because of an unoptimized video, fewer visitors will even start the video. That reduces the number of people who hear your main value story.
- Time to first frame: If the video takes several seconds to start, visitors often scroll past, click elsewhere, or bounce, even if they would have been interested in the content.
- Stability During Key Moments: Stalls during pricing, proof, or social proof sections make the experience feel untrustworthy. Users are less likely to submit their details or commit to a trial when the pitch itself looks unreliable.
For landing pages, a practical way to use video performance metrics is to treat the video as part of the conversion funnel, not as a separate object:
| Step | Metrics to watch | Impact on conversion |
|---|---|---|
| Visitor sees page | Page load time, video thumbnail load success | Affects bounce rate and initial trust |
| Visitor starts video | Play rate, startup time | Affects user volume entering your narrative |
| Visitor reaches CTA moment | Completion to key timestamp, buffering ratio | Affects exposure to your core argument and offer |
| Visitor submits form or starts trial | Conversion rate after view | Affects lead and trial volume |
If you only see the final conversion rate without the layer of playback metrics, it is easy to misread problems. A drop in trial starts might be blamed on messaging or pricing, when in reality, a CDN issue in a key region has quietly degraded video performance for high-intent traffic.
Product and Pricing Pages
On product and pricing pages in SaaS, PLG, and e-commerce, videos usually carry one of three jobs:
- Show how the product actually works
- De-risk the purchase with proof and use cases
- Clarify pricing, packaging, or ROI
Here, playback quality can skew which segments of your audience get convinced:
- Prospects on slower or unreliable mobile networks might never get a smooth view of your explainer, so your conversion data gets biased toward visitors in better conditions.
- If the video looks blurry due to aggressive downscaling, UI details and small text are hard to read, which makes complex products feel harder than they are.
- When pricing explanations are in a video and that video buffers, prospects often leave with an incomplete understanding and postpone the decision.
For these pages, you do not have to overcomplicate the metrics. Focus on:
- Startup time, error rate, and buffering at the geography and device level for visitors who reach pricing and product detail URLs.
- Conversion rate to the next step, such as “view plans”, “start free trial”, or “book demo”, segmented by whether the visitor watched the video and whether their session had performance issues.
That gives you a clear picture of how much revenue is effectively gated behind good video performance.
Sales Demos and Demo Recordings
For sales-led or hybrid motions, live and recorded demos are often the single highest-leverage use of video. Playback quality issues here do not just hurt one metric; they can affect entire opportunities.
Common patterns:
Custom demo recordings sent by email
- If the video starts slowly, stalls, or fails for decision makers on corporate networks, they may never watch the critical sections that address their objections. In some cases, security or firewall quirks can cause errors that a generic host does not handle well.
On-demand demo hubs
Many teams use on-demand demo pages where prospects can self-serve a recorded walkthrough before or after a live call. Poor playback here results in fewer qualified prospects and less educated buyers during live calls.
For demo content, useful metrics include:
- Percentage of invited viewers who start the demo
- Completion of key sections, such as integration walkthroughs or ROI explanation
- Distribution of buffering and errors for corporate networks or specific accounts, when you can identify them
- Progression from demo view to follow-up actions, like booked meetings, proposals, or closed deals
If you can correlate “prospects who watched at least 70 percent of the demo without buffering” versus “those who had issues or bounced early”, the link to opportunity creation and close rate often becomes very obvious.
Email, Lifecycle, and Retargeting Videos
Videos embedded in or linked from email, lifecycle sequences, and retargeting campaigns often target bottom-of-the-funnel actions. Examples include:
- Upgrade prompts in product update emails
- Reactivation flows that showcase a new feature or integration
- Retargeting ads driving to a concise product demo or testimonial video
In these cases, users are already familiar with your brand. Playback quality still matters, but it changes how you read the data:
- Low play rate from email clicks might reflect slow loading or poor mobile performance on the target page rather than weak creative.
- Short watch times can result from either bad targeting or poor delivery. Segmenting by device and network while looking at startup time and buffering helps you separate the two.
If your ESP and video platform are integrated, track:
- Click-through from email
- Play rate and startup time on the landing experience
- Completion to key timestamp
- Target action, such as upgrade or reactivation, within a defined window
From there, you can identify campaigns where better playback could recover conversions without changing copy or creative.
Multi-touch Conversion View
In reality, most conversions are influenced by multiple video touchpoints. A user might:
- Watch a homepage explainer
- See a feature deep dive during onboarding
- Come back later via email to watch a customer story
- Finally, start a trial or upgrade after a short demo recap
For measurement, this does not mean you need a complex attribution system. A practical approach is:
- Identify 3 to 10 videos that are most closely aligned with key conversion events, such as trial start, demo booking, upgrade, or expansion.
- Track Deliver and Engage metrics specifically on those videos by channel and device.
- Compare the conversion rates for users who watched these videos, under acceptable playback conditions, with those of similar users who did not.
This gets you to a simple, defensible statement such as:
- “Visitors who watch our product video on the main landing page to the 60-second mark, with no major buffering, start trials at roughly twice the rate of those who do not.”
Once you have evidence like this, it becomes easier to prioritize video performance work because it is clearly tied to conversion rate optimization rather than abstract streaming quality.
Benchmarks and What “Good Enough To Grow” Looks Like
Benchmarks help you prioritize, but they should not replace your own baselines. Use them as guardrails, then measure improvement relative to your current numbers.
Technical Playback Benchmarks
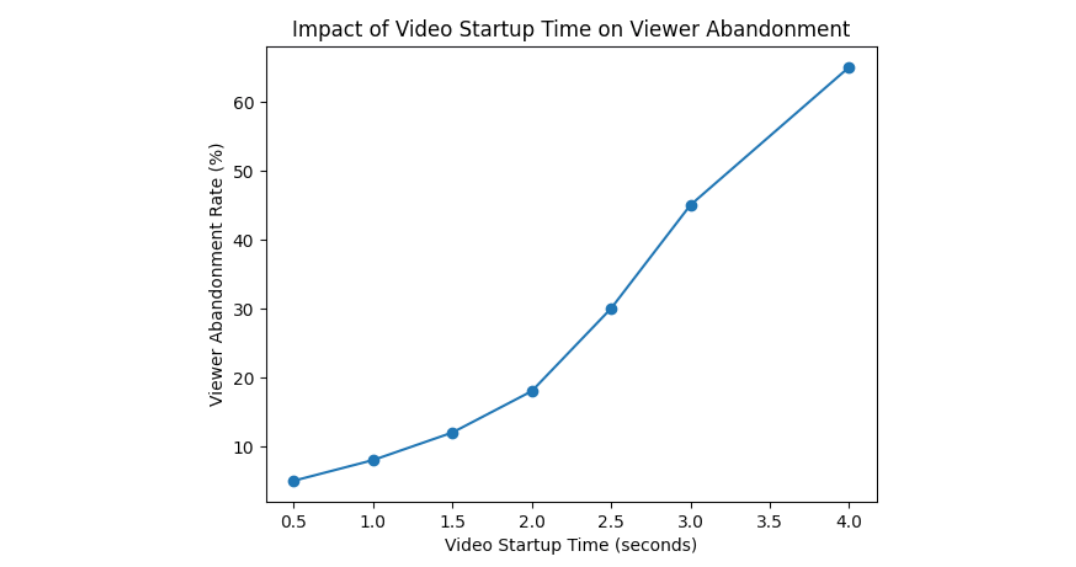
Industry research on streaming quality shows that every extra second of startup delay after about 2 seconds increases abandonment, and that rebuffering sharply reduces watch time and satisfaction.
For SaaS and PLG-style product videos, a practical target set is:
| Metric | Healthy starting target for key videos | Risk signal |
|---|---|---|
| Time to first frame | Under 2 seconds for 80 to 90 percent of plays | More than 3 seconds for a large share of onboarding or demo traffic |
| Rebuffering ratio | Under 0.5 to 1 percent of total watch time (practically) | Rebuffering spikes on specific geos, networks, or devices |
| Playback error rate | Under 0.5 percent on activation and conversion paths | Anything above 1 percent where users are close to a decision |
| Resolution actually delivered | Most plays at 720p or higher on desktop, 480p or higher on mobile | Blurry playback for UI heavy content, especially on desktop |
Focus these targets on the small set of videos that sit closest to activation and conversion. If a marginal help video in a low-traffic corner performs worse, it matters less than a small degradation on your main product demo.
Engagement and Outcome Benchmarks
Engagement benchmarks are highly context-dependent. A 90-second homepage explainer behaves differently from a 5-minute feature walkthrough. As a rough starting point:
| Video type | Reasonable completion to key timestamp | What to watch |
|---|---|---|
| Homepage or campaign explainer (60–120 s) | 40 to 60 percent reaching the main value pitch | Early drop before the product is shown |
| Onboarding tour (60–180 s) | 50 to 70 percent reaching the “how to” step | Users leaving before seeing the workflow |
| Feature deep dive (3–5 min) | 30 to 50 percent reaching the core demo | Only existing users watching to the end |
| Help or unblocker video | 60 percent or more reaching the solution | High drop immediately after intro |
For outcomes, treat these as directional ranges, not hard rules:
- Users who watch onboarding or key feature videos to the main value moment should activate at roughly 1.5 to 2.5 times the rate of similar users who do not watch.
- Visitors who watch a product video to the key timestamp on a landing page convert at least 1.3 to 2 times more often than those who skip it.
If you are below those ranges, that is a strong signal to dig into both performance and content. If you are already there or better, benchmarks have done their job and the next step is to run experiments, not to chase arbitrary global “best in class” numbers.
How to Use Benchmarks in Practice
A clear way to apply all of this:
- Pick 3 to 5 videos that are closest to activation or revenue.
- Check their “Deliver” metrics against the technical targets above. Fix obvious performance issues first.
- Check completion to the key timestamp for each video against the engagement ranges, then tighten structure and CTAs where needed.
- Measure activation or conversion lift for users who watch to the key timestamp, versus those who do not. Aim for a clear, defensible uplift, even if the exact percentage varies by product.
The goal is not to hit perfect numbers in an abstract sense. It is to be confident that your most important videos are technically reliable, actually watched to the relevant moments, and clearly associated with better activation and conversion outcomes.
How to Improve Video Performance and Where a Video Hosting Platform Like Gumlet Fits
By this point, the job is clear: protect “Deliver”, improve “Engage”, and connect both to “Convert”. This section focuses on concrete moves that improve playback quality and make it easier to prove impact, with examples of where a platform like Gumlet takes work off your plate.
Fix Video Delivery First
If startup time, buffering, or errors are weak on key videos, treat that as infrastructure work, not content work.
Priority actions:
- Use adaptive streaming, not progressive download: Encode multiple renditions and serve them via HLS or DASH so that viewers on slower networks can still watch smoothly while those on faster connections get higher quality.
- Revisit encoding settings: For UI-heavy product videos, aim for resolutions that keep text crisp (typically at least 1080p source with 720p renditions) and bitrates that balance clarity against stall risk.
- Leverage a global, multi-CDN setup: Route users to nearby PoPs and switch away from degraded routes automatically instead of relying on a single CDN.
- Optimize player load and startup path: Avoid blocking scripts, lazy load videos below the fold, and preconnect to critical domains on high-value pages like main product demos and onboarding.
- Harden secure delivery: Use signed URLs or tokens, domain and referrer restrictions, and DRM or encryption where needed so you can keep performance high without exposing private or paid content.
A platform like Gumlet handles most of this automatically:
- Receives your uploads or pulls from existing storage
- Transcodes into multiple renditions and codecs
- Delivers via a globally distributed infrastructure with smart routing
- Applies tokenization and domain-level controls for secure playback
So your team spends its time choosing which videos matter, not hand-tuning infrastructure.
A compact view of what to improve and why:
| Problem on key videos | Likely cause | Fix at platform level |
|---|---|---|
| Slow start on some geos | Weak routing or single CDN | Multi CDN, smart routing, caching at edge |
| Frequent stalls on mobile | Bitrate too high, no adaptive streaming | ABR (Adaptive Bitrate) streaming with mobile-friendly renditions |
| Errors for certain embeds or apps | Token issues, referrer problems, wrong formats | Proper token policies, domain restrictions, modern codecs |
| Blurry UI or unreadable text | Overcompressed video, low resolution delivered | Better encoding ladder and quality-aware streaming |
Improve Content Structure and Viewing Experience
Once Deliver is healthy on your most important videos, shift focus to Engage. You want users to reach the value moment with as little friction as possible.
Practical edits:
- Front load value: Move the first proof or result into the opening 5 to 10 seconds. Long intros and logo stings often appear as early drop-offs in heatmaps.
- Shorten or break up long videos: Split a 7-minute tour into a concise overview plus chaptered or separate deep dives. Many users only need the overview to activate.
- Use chapters and timestamps: For in-product tours and feature explainers, chapters help advanced users jump straight to what they care about without having to scrub.
- Add captions and transcripts: Helps on-muted autoplay, noisy environments, and for users who prefer skimming. Also reduces support friction for non-native speakers.
- Place CTAs where the user is convinced, not just at the end: If watch data shows a strong value moment at 40 seconds, experiment with a non-intrusive CTA or highlight it there, not only in the last frame.
Platforms like Gumlet make this easier by giving you:
- Heatmaps and per-second attention graphs for each video
- Device and region-level breakdowns of watch behavior
- In-player CTAs and forms that can be added without custom dev work
Thanks to these features, content and growth teams can iterate quickly based on real viewing data rather than just opinions.
Run Targeted Experiments, Not Random Tweaks
To avoid endless rework, treat video improvements like any other optimization program.
Suggested approach:
Choose a small set of high-impact videos
- Homepage or main campaign explainer, onboarding tour, one feature walkthrough, one demo, or pricing explainer.
Baseline Deliver, Engage, and Convert metrics
- Capture startup time, buffering, completion to key timestamp, and post-view activation/conversion rates for a few weeks.
Form simple hypotheses
Examples:
- “If we reduce startup time on the onboarding tour below 2 seconds for 90 percent of users, activation will rise by at least 5 percentage points.”
- “If we move the main value claim from 45 seconds to 15 seconds, more viewers will hit the CTA, and trial starts will increase.”
Implement one change at a time, where possible
- For structural changes, use A/B testing on pages or player configuration. For infrastructure changes, roll out carefully and compare cohorts over time.
Measure uplift on outcomes, not just engagement
Treat a change as successful only if it improves activation or conversion, not just watch time.
Gumlet supports this style of work by:
- Exposing granular metrics at video, page, and segment levels
- Streaming events into analytics tools so you can build your own experiments and dashboards
- Allowing configuration changes at the player and delivery level without redeploying your whole app
So you can treat video performance as a continuous optimization loop rather than a one-off project.
4. Make “Video Health” Part of Your Routine Checks
Finally, integrate video performance into the regular hygiene of your product and marketing stack:
- Include a short video performance section in your monthly growth or product review
- Track a small set of SLO-style (Service Level Objective) targets for startup time, buffering, and errors on key videos
- Alert when these degrade, especially after major launches, CDN changes, or large campaigns
- Periodically re-validate the link between clean viewing sessions and activation/conversion
With a platform that reports quality, engagement, and outcomes in one place, this becomes a fast check rather than a deep investigation every time.
Turn Video Performance Into a Predictable Activation and Conversion Lever
If video sits anywhere near your onboarding, product tours, help content, or demo flows, playback quality is not a cosmetic detail. It is a direct driver of activation, opportunity creation, and revenue. Users rarely complain about buffering or slow start times. They simply abandon the session, skip onboarding, or delay the decision, and those leaks show up later as weak activation and conversion metrics.
The most reliable way to manage this is to treat video performance in three layers: Deliver, Engage, Convert. “Deliver” asks whether users can actually watch your videos smoothly across real devices, networks, and regions. “Engage” checks whether they reach the specific value moments that explain your product and unblock their next step. “Convert” ties clean viewing sessions to activation events, signups, upgrades, and long-term value.
If Deliver is weak, you fix the infrastructure. If Engage is weak, you fix the structure and in-player UX. If Convert is weak, you fix positioning, CTAs, and how the video connects to the rest of the funnel.
To make this actionable, you only need a focused set of steps. Identify the small group of videos closest to activation and key conversions. Get their playback quality into a healthy range using adaptive streaming, sensible encoding ladders, and robust delivery. Use heatmaps and completion to key timestamps to tighten your scripts and move value earlier. Then link video events to product and revenue events so you can measure activation and conversion lift for viewers versus non-viewers, and run experiments judged by outcomes, not just watch time.
A modern infrastructure-level platform makes this far easier. With a video hosting partner like Gumlet handling ingestion, transcoding, secure delivery, and detailed analytics, you can see Deliver, Engage, and Convert metrics in one place and stream them into your existing analytics stack. That lets product, marketing, and revenue teams treat video performance as a standard growth lever instead of a black box owned by a separate team.
If you want to reach that point faster, the next step is simple. Schedule a demo with Gumlet and review your own activation and conversion flows through the lens of playback quality, engagement, and outcomes.
FAQ:
1. Which video performance metrics matter most for conversion rate?
For conversion, the most useful metrics are the ones that connect playback quality and viewing behavior directly to outcomes:
- On the Deliver side: startup time, buffering ratio, and playback error rate for videos that sit next to key CTAs (trial start, demo request, upgrade).
- On the Engage side: completion to the specific timestamp where you present the main value or offer, not just generic completion.
- On the Convert side: activation or conversion rate within a defined window after a clean viewing session, plus the uplift versus similar users who did not watch.
If you can only track a handful of numbers, track: startup time, completion to the key moment, and conversion rate after view, segmented by device and channel.
2. How do I know if buffering is actually hurting signups and activation?
You can answer this in a straightforward way if your video and product analytics are joined:
- Identify a few videos that sit close to the signup or activation process.
- Segment viewers into sessions with acceptable playback (startup under your target, low buffering, no errors) and sessions with notable issues.
- Compare signup or activation rates between these groups, controlling for basic factors such as channel or device.
If users with clean playback activate or convert significantly more often than users who experienced buffering or failures, you have hard evidence that performance is suppressing growth. If there is no difference, the problem is likely content, targeting, or placement rather than infrastructure.
3. What is a “good” completion rate for onboarding or demo videos?
It depends on length and intent, but a useful rule of thumb:
- For 60–180 second onboarding tours, you typically want at least half of the viewers to reach the point where you show how to complete the first key action.
- For short product demos on landing pages, it is reasonable to expect 40–60 percent of viewers to reach the main value pitch, even if fewer make it to the exact end.
- For deeper feature walkthroughs, completion to the core demo section in the middle of the video matters more than end to end completion.
If you are far below those ranges, check Deliver first (slow start and buffering), then edit structure: shorten intros, move the value moment earlier, and use chapters where appropriate.
4. How can I track whether viewers are more likely to activate or convert?
You need three ingredients:
- Consistent IDs: Ensure video playback events and product / CRM events share a user ID, anonymous ID, or session ID.
- Clear definitions: Decide what counts as “viewed” (for example reached 60 or 75 percent of the video, or a specific timestamp) and what counts as activation or conversion (for example first project created, trial started, demo booked).
- Simple comparisons: Build a report that compares activation or conversion rates for:
- Users who reached the view threshold with acceptable playback
- Similar users who did not view the video at all
A video infrastructure platform that can stream raw events into your analytics tools makes this much easier. With something like Gumlet wired into product analytics, you can build these comparisons as standard funnel or cohort reports instead of custom one-off analyses.
5. Do I need separate tools for video analytics and product analytics?
You usually need both capabilities, but not necessarily two completely isolated tools:
- A video infrastructure / analytics platform should handle hosting, delivery, playback quality metrics, engagement metrics, and secure streaming of raw events.
- A product or marketing analytics stack should handle funnel analysis, user and account level behavior, and revenue attribution.
The key is that your video platform must integrate cleanly with the rest of the stack, ideally by sending detailed events (play, progress, errors, CTAs) into your analytics pipeline or warehouse. That way you avoid a standalone “video dashboard” that cannot answer activation or revenue questions.
Gumlet, for example, is designed to sit at the infrastructure layer for video while feeding events into tools you already use, so you can analyze video performance next to signups, activation, and revenue without stitching together screenshots and exports.
6. How long should activation or conversion-focused videos be?
Length is secondary to time to value:
- For onboarding and main product explainers, most teams do well in the 60–180 second range, provided the first clear value moment appears within the first 10–20 seconds.
- For feature deep dives and training content, 3–5 minutes can work if broken into logical chapters and used for users who already have intent.
- For demo recaps or decision support videos (for example short clips sent after a sales call), concise 60–90 second summaries focused on the specific decision usually perform best.
Use real watch data to refine this. If heatmaps show that most users drop just before the value moment, the video is too slow to get to the point, regardless of total length.
tl;dr
- Most teams judge video success by views and a generic completion rate, while poor playback quietly harms trial activation, feature adoption, and conversions.
- The article frames all video performance metrics into three layers that mirror your funnel: Deliver (playback quality), Engage (viewing behavior), and Convert (outcomes).
- Deliver focuses on startup time, buffering, error rate, and quality by device, network, and region, so you can see whether users can actually watch smoothly.
- Engage looks at play rate, completion to key timestamps, heatmaps, and in-player CTAs to confirm users reach the specific value moments that drive action.
- Convert ties clean viewing sessions to activation events, signups, upgrades, and revenue, and compare viewers vs non-viewers to quantify real impact.
- The article shows how playback quality affects activation in PLG and SaaS (onboarding, feature discovery, help content) and conversion on landing pages, product pages, and demos.
- It outlines the minimum event set you should track, then shows how to plug video events into your product analytics, CRM, and BI so video is not a data silo.
- Practical benchmarks are provided for startup time, buffering, error rate, and engagement across key video types, with guidance on benchmarking against your own baselines.
- It gives a clear improvement plan: fix delivery first, then tighten structure and UX, then run focused experiments judged by activation and conversion, not just watch time.
- Gumlet is positioned as the infrastructure layer that handles hosting, secure delivery, and deep video analytics so teams can track, deliver, engage, and convert in one place and feed those metrics into their existing stack.