
As online video consumption increases, digital creators are competing for audience attention with compelling content. To boost revenue and deliver effective content, publishers need sustainable strategies that enhance engagement and inspire desired actions from the audience. Reach and traffic alone are insufficient; media publishers need an engaged audience.
Regularly measuring video engagement analytics provides valuable insights into audience viewing habits. A weekly or bi-weekly strategy can drive engagement and increase ad revenue. However, determining which specific KPIs matter most to you can be challenging due to available parameters.
There are so many other things that you as a video business owner would be confused about. It's not just the metrics but how the overall online video business can do better. For guidance on starting and growing your online business, visit ImminentBusiness. They provide the best resources and insights that can support your online business.
What are Video Engagement Metrics?
Video engagement metrics are key performance indicators (KPIs) that give you insight into the success of your video content. They help you determine how your viewers are interacting with the content you publish. For example, YouTube's analytics include likes, dislikes, viewer count, shares, playback completion rate, clicks, etc.
Regularly monitoring engagement metrics helps determine the success of a campaign and whether it needs further adjustments. Brands and marketers use their strategies to measure performance, such as boosting ad revenue, building subscriber bases, and increasing sales.
51% of publishers view boosting video engagement as a significant challenge. To increase video marketing revenue, it's crucial to track performance, define primary goals, and identify engagement metrics.
Why tracking Video metrics is essential for Creators?
Video is taking the internet by storm; it is expected to dominate 79% of all mobile traffic by the end of 2023. From live streaming and webinars to tutorials and online courses, video engagement has become one of the most effective marketing tools to meet business goals.
Nearly 86% of businesses leverage video as a central marketing strategy, and close to 87% of marketers report success in yielding a positive ROI.
Understanding and actively tracking video analytics is the cornerstone of success for video publishers. It provides qualitative data to assess the impact of your video on your audience and boost your organic reach.
In addition to this, it helps you secure:
- Additional revenue: Video engagement has a direct impact on potential ad revenue; it helps you build an authentic connection with your viewers—who then actively engage with your content and are more likely to respond to ads.
- Sustainability and competitive advantage: Since the COVID-19 pandemic has driven online video consumption to an all-time high, every creator, producer, distributor, and publisher of content is actively vying for audience attention—and engagement is the one currency that determines who'll come on top and thrive.
- A subscriber base or loyal customers: Tracking video analytics helps you optimize your content for engagement from new and returning customers. For example, social shares are an excellent indication of brand loyalty and affinity. It helps build brand credibility. A loyal and engaged audience is more likely to sign up for your subscriptions or buy from you.
Before you dive into checking out the top metrics to track for your video, check out how you can implement Gumlet's Video Analytics and start tracking the performance of your videos like never before.
Top Video Metrics to Measure Your Video Engagement
Let's look at the top video engagement metrics every publisher should be monitoring to improve video engagement:
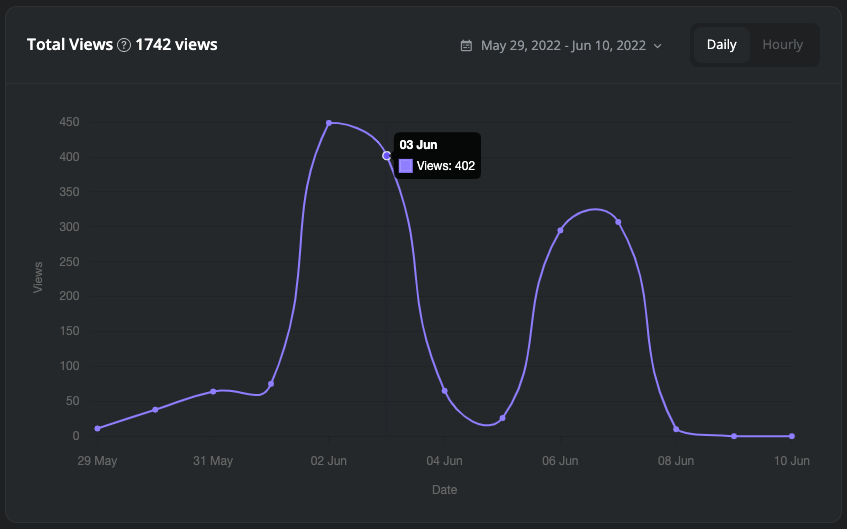
Total Views
Total Views is the number of playbacks of videos, which were started by the viewers. Total views will always be less than or equal to the total number of playbacks that were initialized on the platform.
A low number of views indicates that your video placement is off (irrelevant to the subject of the page) or that your content creatives aren't enticing enough.
However, it depends on how a particular platform counts a view. For instance, for some video channels, 3 seconds of watch time might count as a view, whereas for another, it could be 30 seconds.
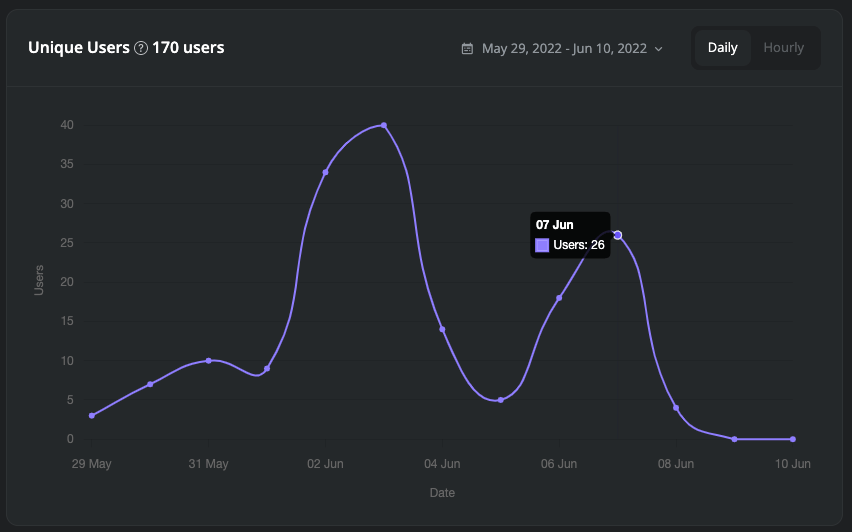
Unique Users
This metric gives insight into your true reach; it shows how many unique viewers have watched one or more of your videos. Marketers typically track unique users to get a hang of their return viewer rates, which is important because it allows you to optimize your video content effectively.
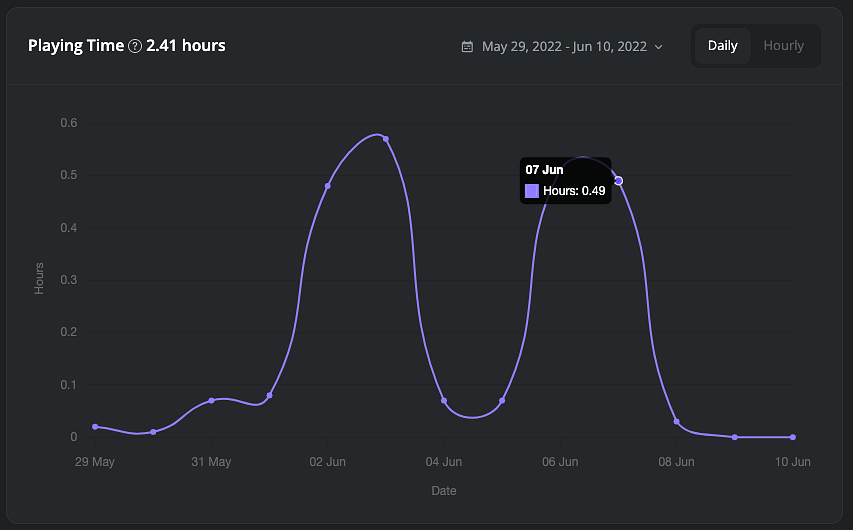
Watch time
Watch time or playing time refers to the total time your audience spends watching a video you publish or share. Watch time is the total time a video was watched by all users who started watching it.
YouTube relies on watch time to rank videos in the featured section of users.
Completion rate
One of the most useful metrics of video engagement is the video completion rate, which measures completion against plays. Completion rates of a video are measured as follows - 10%, 20%, 30% till 100%. These metrics provide a more highly detailed view into how long viewers stayed engaged with a video. It helps publishers to optimize video duration and CTA placement by understanding common drop-off points. If all users are watching the video till the end, the completion rate would be 100%.
The completion rate is an excellent metric to determine how engaged your audience is. The higher the percentage, the more invested they are in your video. It is monitored in two ways:
- Playback completed by users
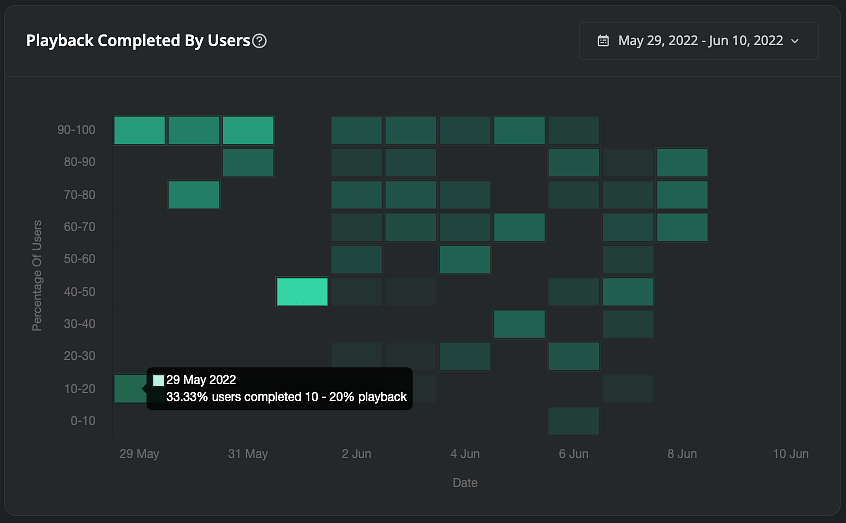
- Playback completed by views
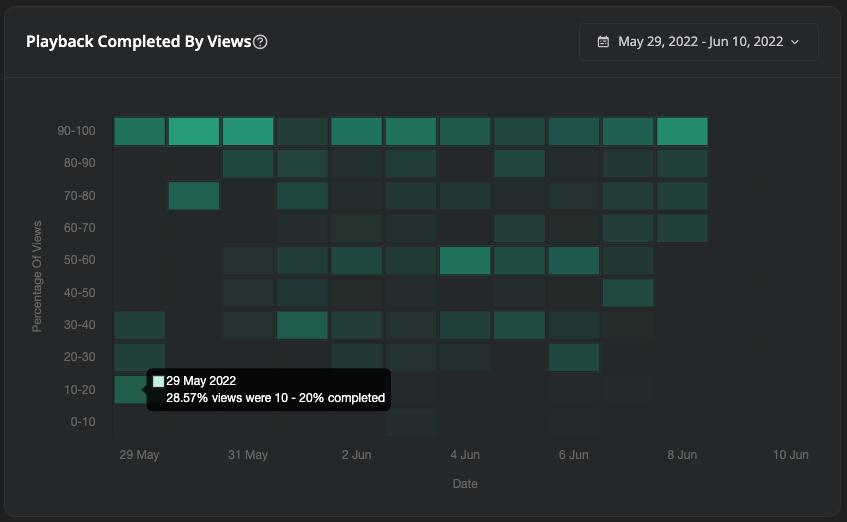
Facebook leverages the completion rate to decide how videos will be ranked in a user's news feed.
Naturally, your goal should be to create videos that are unskippable so viewers stick around till the end.
A low number of views indicates that your video placement is off (irrelevant to the subject of the page) or that your content creatives aren't enticing enough.
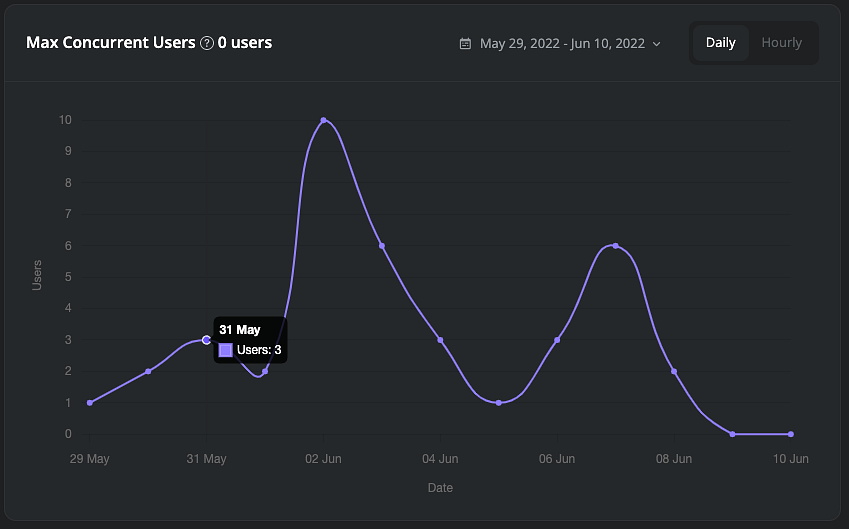
Max Concurrent Users
Max concurrent users are the maximum number of viewers watching videos on the platform at the same time. Not everyone necessarily watching the same video. Every user can be viewing a different video and these users can be filtered from a particular video.
By tracking your concurrent users, you can determine your peak traffic hours during the day or week.
Real-time viewers
As the name suggests this metric gives the real-time data of the users that are watching content on your platform in real-time. For example, you can see how many people are joining your live stream and are continuing to watch it (for consecutive minutes or till the end.
Top Video Analytics Tools to Track Your Video Engagement
Choosing the right video analytics tools depends on your specific needs and platform focus. However, here are some top contenders known for tracking video engagement across various platforms:
- Gumlet Video Insights: Gumlet Video Analytics packs a punch for tracking true video engagement, especially if video delivery and optimization are your focus. It goes beyond basic views and likes to reveal metrics like unique viewers, completion rates, and peak watch times, giving you a clear picture of how your audience interacts with your content. You can then analyze this data across devices, platforms, and demographics to understand specific audience behaviors and tailor your content and delivery for maximum impact. Gumlet doesn't just provide data; it offers actionable insights and a user-friendly interface, all included in their video hosting plans, making it a cost-effective option for getting the most out of your videos.
- Google Analytics: Free and widely used, Google Analytics can track video engagement on your website through video tracking features. You can see metrics like average watch time, completion rate, and traffic sources.
- Finteza: A free website analytics tool, Finteza offers video analytics that track views, engagement, and audience demographics. It's a good option for those looking for a basic, free solution.
- ViralStat: Tracks and analyzes video performance across Facebook, Instagram, and YouTube. You can monitor trending videos, research competitor strategies, and identify potential influencers.
Other Online Video Metrics To Track Video Performance
Latency and buffering metrics are some other video metrics that can help you track your video delivery performance. These metrics are crucial for understanding the user experience and identifying areas for improvement.
Latency & Buffering Metrics:
- Player and video startup times: Measure the time it takes for the player and video to start playing, ensuring viewers don't encounter frustrating delays.
- Seek latency: Track how long it takes for the video to resume playback after viewers seek to a different point. High seek latency can lead to frustration and drop-off.
- Rebuffer Metrics: Identify how often and for how long playback stalls, giving you insights into potential network bottlenecks or encoding issues.
- Playback Errors: These metrics help you understand whether your videos are playing flawlessly across platforms, players and devices and resolve playback errors.
Gumlet lets you track all these latency and buffering metrics effortlessly. By tracking a combination of these engagement, delivery, audience, and marketing metrics, you can gain a comprehensive understanding of your video's impact and optimize it for maximum success.
Conclusion
Video engagement is the one factor that helps you determine how effectively a video is resonating with your audience.
With new-age video hosting platforms like Gumlet that provide you with comprehensive data to determine how your media content is performing, you can effectively leverage video insights to align your video campaigns with your business objectives.
FAQs
1. What are good video metrics?
Some good video metrics are: View Count, Watch Time, Average View Duration, Engagement Rate, Likes-Shares-Comments and Click-Through Rate.
2. What are the top metrics you will measure for YouTube videos?
The top metrics that you will measure for YouTube are: Watch Time, Average View Duration, Audience Retention, Traffic sources, and Impressions Click-Through Rate.
3. Which metrics drive engagement?
The video metrics that primarily drive engagement are Video views, Likes, Shares, Comments, Play Rate and Retention Rate.
4. What is the difference between views and engagement?
Views indicate how many people have seen the content, while engagement indicates how many people interacted with the content.