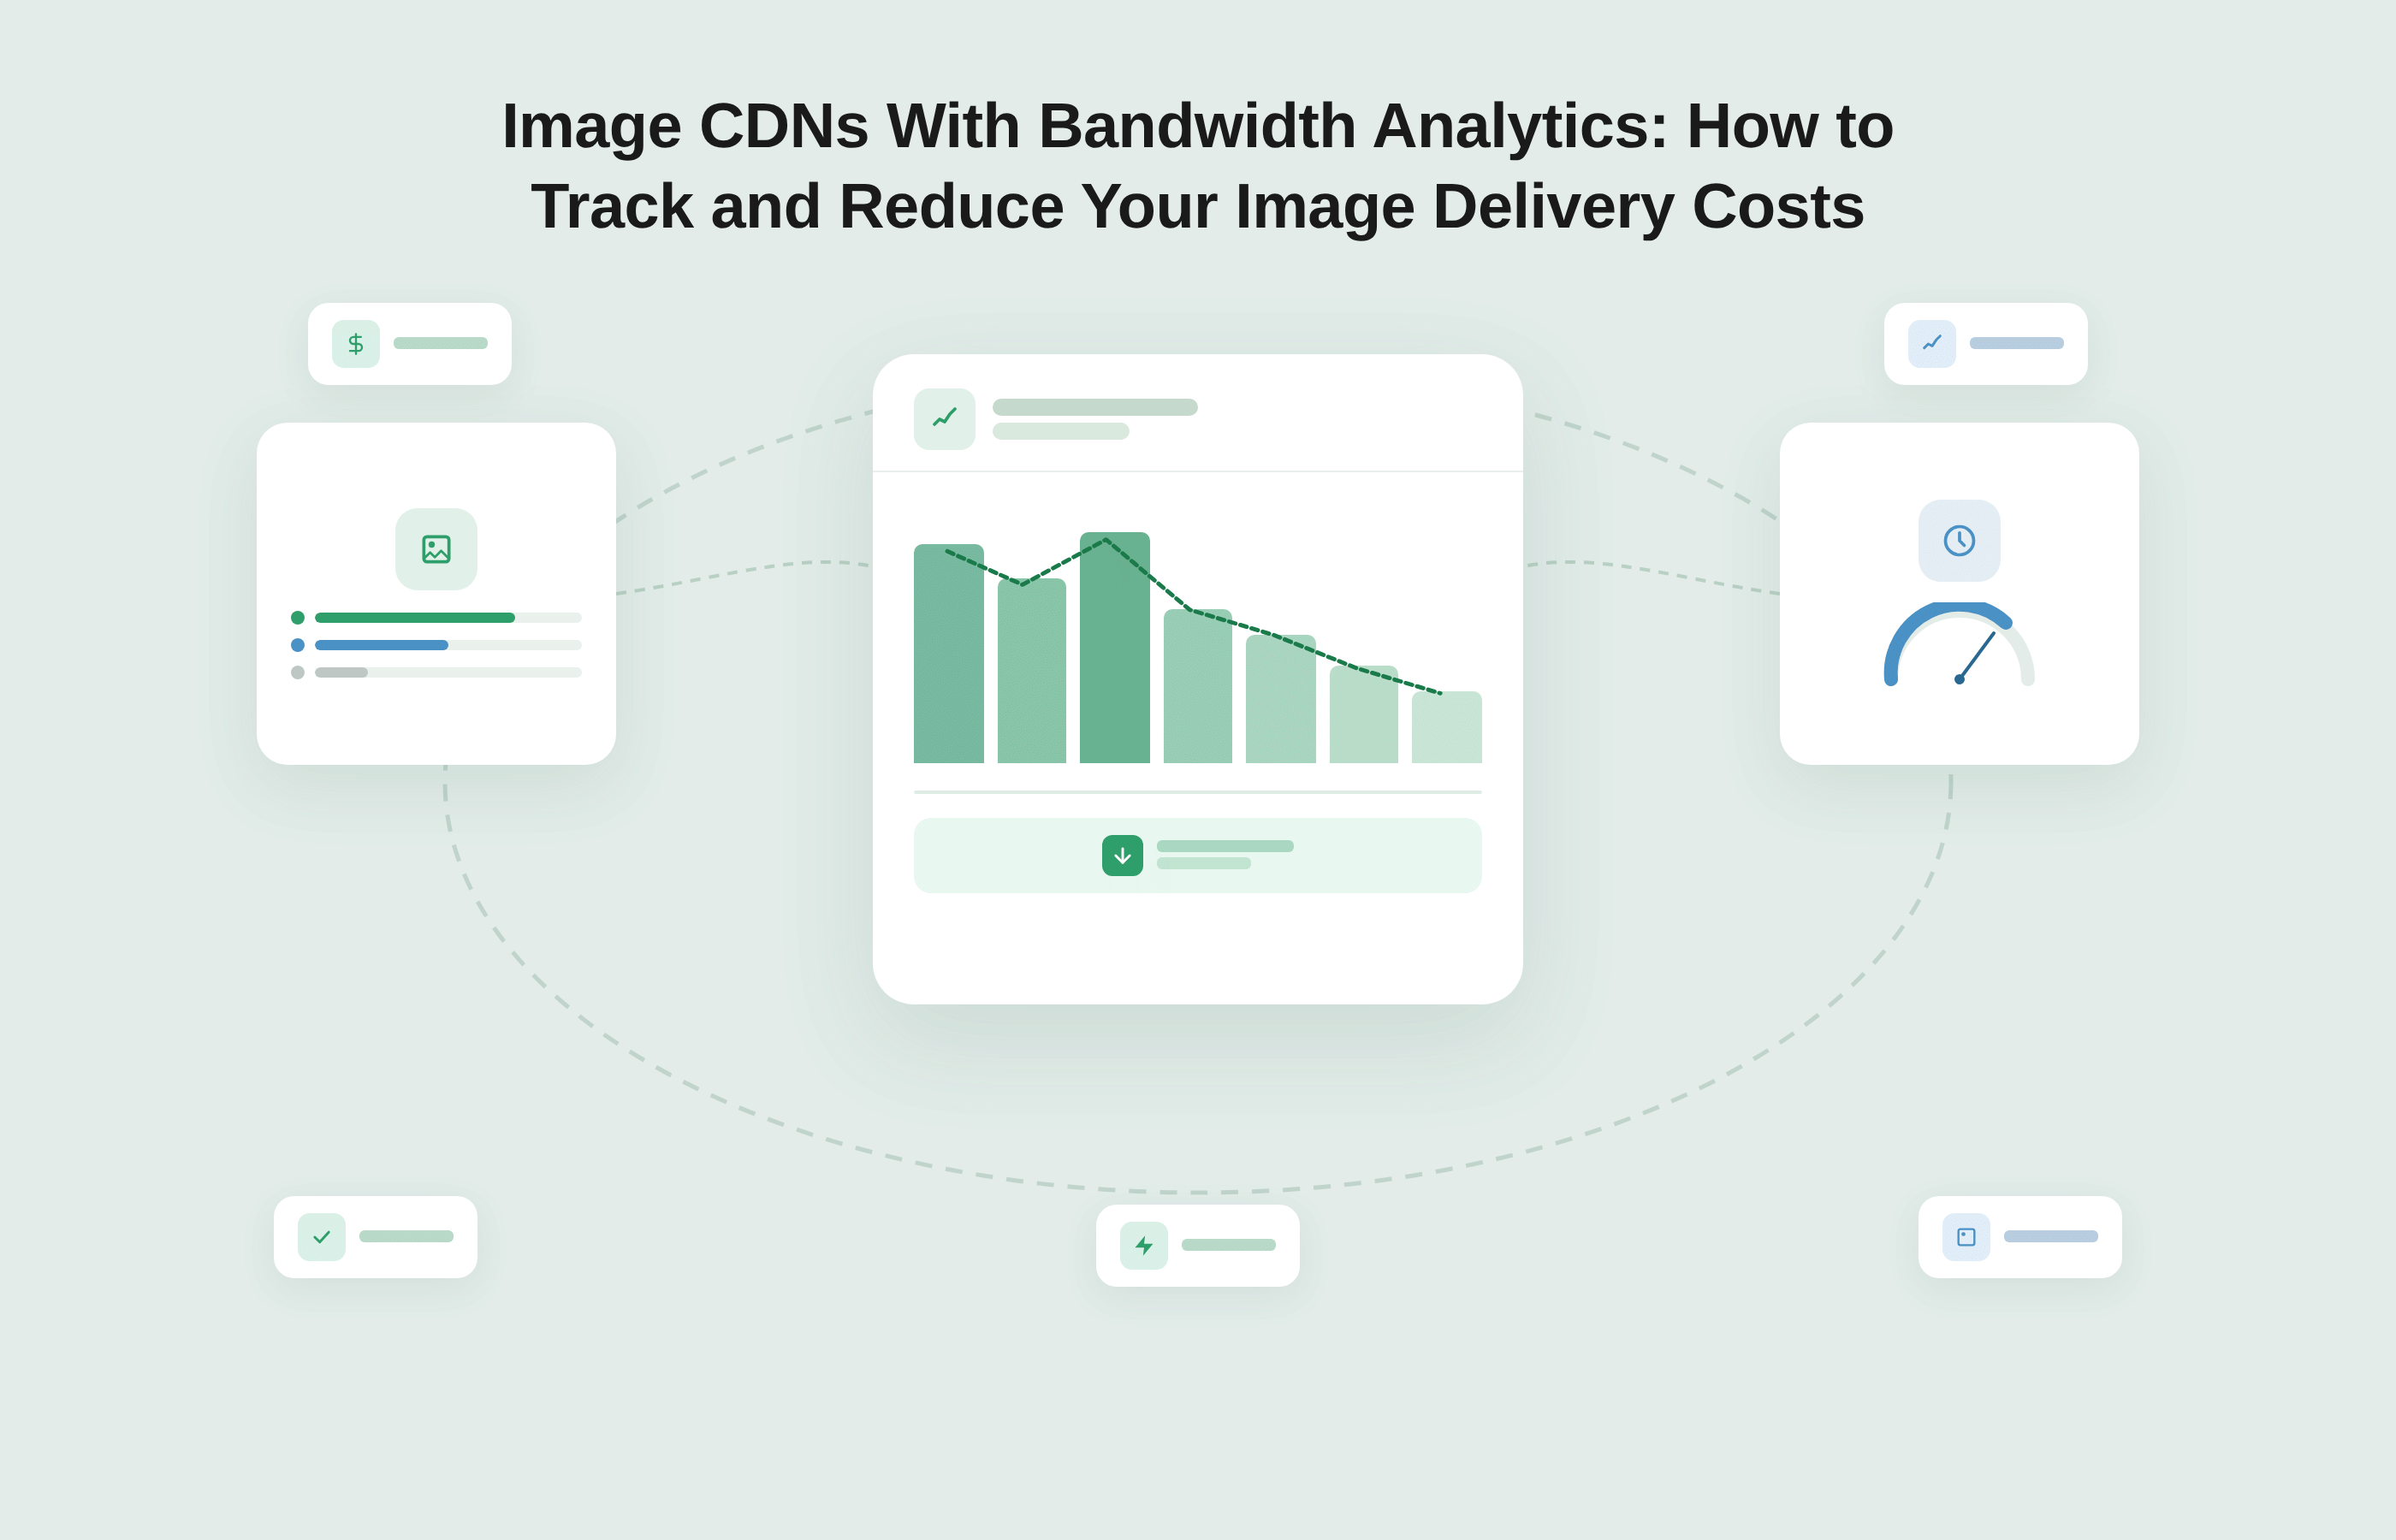
An image CDN with bandwidth analytics shows you exactly where your delivery spend is going: which sources are consuming the most data, what formats are being served, how often requests are hitting cache versus pulling from origin, and how many transformation variants are being generated per session.
The fastest path to reducing image delivery costs is not to switch vendors or redesign your asset pipeline.
It is reading your existing analytics data through a cost-reduction lens and acting on what it reveals. Platforms like Gumlet surface these metrics per source in real time, in the same bandwidth unit your bill is denominated in, so there is no translation layer between what the dashboard shows and what you actually pay.
Your CDN bill grew again last month. You know it happened.
You have a theory that it is connected to the product launch three weeks ago, or maybe the new campaign landing page with the hero image carousel. But you cannot pinpoint which image source, route, or configuration gap is responsible, because your current setup shows you a total bandwidth number and not much else.
This is one of the most expensive blind spots in modern web infrastructure. According to SpeedCurve's 2025 Page Bloat report, images account for nearly 60% of total page weight at the 90th percentile, making them the single heaviest asset category on the web by a significant margin.
Yet most teams invest far more energy optimizing performance metrics than they spend understanding and actively controlling image delivery costs.
The gap between "spending more on image delivery" and "knowing exactly why" is not a data problem. It is an analytics problem. Not every image CDN gives you the visibility you need to connect delivery decisions to cost outcomes. Those that do can serve as proactive cost-reduction tools, not just post-incident dashboards.
This article explains what bandwidth analytics in an image CDN actually surface, how to read that data with cost-reduction in mind, and which actions yield the fastest results.
Who this article is for: This guide is written for engineering leads, DevOps engineers, and technically-minded product managers at SaaS, e-commerce, and media companies where image delivery is a meaningful infrastructure cost. If your site serves more than 50,000 monthly visitors, images appear across product listings, landing pages, or editorial content, and your CDN spend is growing faster than your traffic, this article is for you.
Key Takeaways
- Image CDNs with built-in bandwidth analytics give you the data to reduce delivery costs proactively, not just monitor performance after the fact.
- The key metrics to track are CDN hit rate, format distribution, per-source bandwidth, and transformation volume.
- These four variables constitute the Four Cost Levers of Image Delivery: format efficiency, dimension accuracy, cache efficiency, and request volume.
- Platforms that surface all four in a single dashboard, with pricing denominated in bandwidth rather than opaque credits, let you connect configuration changes directly to cost outcomes.
- Most teams can reduce image delivery costs by 30% or more by acting on analytics data alone, without changing their origin storage or rebuilding their image pipeline.
What Bandwidth Analytics in an Image CDN Actually Show You
The phrase "bandwidth analytics" gets used loosely, and it is worth being precise about what a well-instrumented image CDN should actually report.
At a minimum, you should see total data transferred, broken down by source or origin, the distribution of image formats being served (JPEG, PNG, WebP, AVIF), and your CDN hit rate over a selectable time period.
These are not vanity metrics. They are the inputs to every meaningful cost-reduction decision your team will make.
The distinction that matters most is between aggregate-only reporting and source-level reporting. A dashboard that tells you "you delivered 120 GB this month" is useful for invoicing. A dashboard that tells you "Source A delivered 80 GB, 62% of which was JPEG, and your cache hit rate for that source was 68%" tells you where to act. One is a receipt. The other is a cost-reduction tool.
CDN Hit Rate and Cache Efficiency
A CDN hit rate is the percentage of image requests served directly from an edge cache node, without pulling the file from your origin server. If your hit rate is 70%, it means 3 out of every 10 requests are triggering an origin pull: slower for the user, more expensive per request, and on some image CDN pricing models, a potential factor in transformation billing.
For a well-configured image CDN, a hit rate below 85% is worth investigating. Common causes include cache TTLs (Time To Live) set too short, too many transformation variants being generated per URL (which fragments the cache into thousands of distinct entries), or origin URLs that change frequently due to CMS-generated filenames or query string variations.
Identifying the cause from analytics takes minutes. Fixing it usually requires a single configuration change.
Format Distribution Reports
Format distribution tells you the percentage of image requests being served in each format across all your CDN traffic.
This metric matters because the format gap is often the single largest source of avoidable bandwidth spend, and it is frequently invisible unless you are explicitly looking for it.
According to Google's WebP documentation, switching from JPEG to WebP reduces file sizes by 25 to 35% at equivalent visual quality.
AVIF, developed by the Alliance for Open Media, goes further: its AV1-based compression delivers images that are 40 to 60% smaller than JPEG equivalents at comparable fidelity.
A format distribution report showing 70% of your requests still going out as JPEG, when your image CDN supports automatic format negotiation, means you are leaving a significant and fully quantifiable cost reduction on the table every single day.
Per-Source and Per-URL Bandwidth Breakdown
Per-source analytics are the feature that separates cost-visible platforms from monitoring-only platforms.
When you can filter bandwidth data by origin source, you can answer questions like: "Which of our three image origins caused last Tuesday's spike?" and "Why does our blog consume twice the bandwidth per visit as our product pages?"
Without this level of granularity, cost-reduction work is guesswork. You might optimize the wrong source entirely, or spend engineering cycles on an origin that was already well-configured while the expensive one continues compounding.
The Four Cost Levers of Image Delivery
Image delivery costs are determined by four controllable variables. Understanding which one is misaligned in your specific stack tells you exactly where to focus first.
We call this framework the “Four Cost Levers of Image Delivery”. Each lever maps to a specific metric visible in a well-instrumented image CDN dashboard, and each has a direct line to a specific cost driver in your monthly bill.
The value of thinking in terms of levers, rather than a generic optimization checklist, is that it makes prioritization immediate. Not every site has a format efficiency problem. Not every stack has a cache fragmentation problem. Reading your analytics through this framework tells you which lever is the primary cost driver for your specific deployment.
Lever 1: Format Efficiency
Format efficiency measures what percentage of your images are being served in modern formats (WebP or AVIF) versus legacy formats (JPEG or PNG).
Every image served as a JPEG to a browser that accepts AVIF is unnecessary data transfer with zero visual benefit to the user.
A site currently delivering 50 GB of JPEG images monthly could realistically reduce that to 20 to 30 GB with full AVIF adoption, based on the 40 to 60% file size reduction that AVIF compression delivers.
That reduction scales linearly against your per-GB CDN rate. The format distribution report in your image CDN dashboard is the only way to see how large this opportunity is for your specific traffic mix. For a detailed breakdown of when to choose AVIF versus WebP, Gumlet's AVIF vs. WebP format comparison covers the trade-offs across quality, browser support, and encoding overhead.
Lever 2: Dimension Accuracy
Dimension accuracy measures whether images are being delivered at the size they are actually displayed, or at a larger size that the browser scales down before rendering.
A 2,400px-wide original served to a 400px display container wastes approximately 97% of the pixels transferred. That waste is invisible to the user but fully billable as bandwidth.
On many production sites, mobile visitors bear the highest cost of this problem. Without responsive image sizing that generates device-appropriate variants, mobile browsers routinely receive desktop-resolution images they cannot use.
What to look for in your analytics
Dimension accuracy does not have a single named metric the way cache hit rate does, but it is readable from the combination of bandwidth per source and request volume.
If a source is generating high bandwidth relative to its request count, and your pages use responsive layouts, oversized image delivery is a likely cause. The diagnostic step is to pull a sample of high-traffic pages, inspect the rendered image dimensions in the browser, and compare them against the actual file dimensions being served.
Any image where the served width exceeds the rendered container width by more than 2x is a dimension accuracy problem.
On Gumlet, enabling the w parameter with a defined breakpoint set automatically constrains delivery to the requested width. Auditing your transformation URLs for sources without defined width parameters is the fastest way to identify which origins are the primary contributors to dimension waste.
Lever 3: Cache Efficiency
Cache efficiency is your CDN hit ratio: the proportion of image requests served from edge cache rather than from origin.
The cost difference is significant at scale. If you serve 100 GB of images monthly at a 70% hit rate, roughly 30 GB is being pulled from origin on every request. Raise that hit rate to 95%, and origin traffic drops to 5 GB. The 25 GB difference is both a latency improvement for users and a direct cost reduction you can calculate before making a single change.
The most common cause of low cache hit rates is variant fragmentation: too many slightly different transformation URLs for the same base image, each treated as a distinct cache entry.
Responsive image logic that generates 15 breakpoints instead of five, or transformation parameters that vary dynamically on each request, are the most frequent culprits.
Lever 4: Request Volume and Transformation Load
Request volume measures how many transformation variants are being generated per session.
On image CDNs that charge per transformation in addition to bandwidth, this lever has a direct and often under-examined cost.
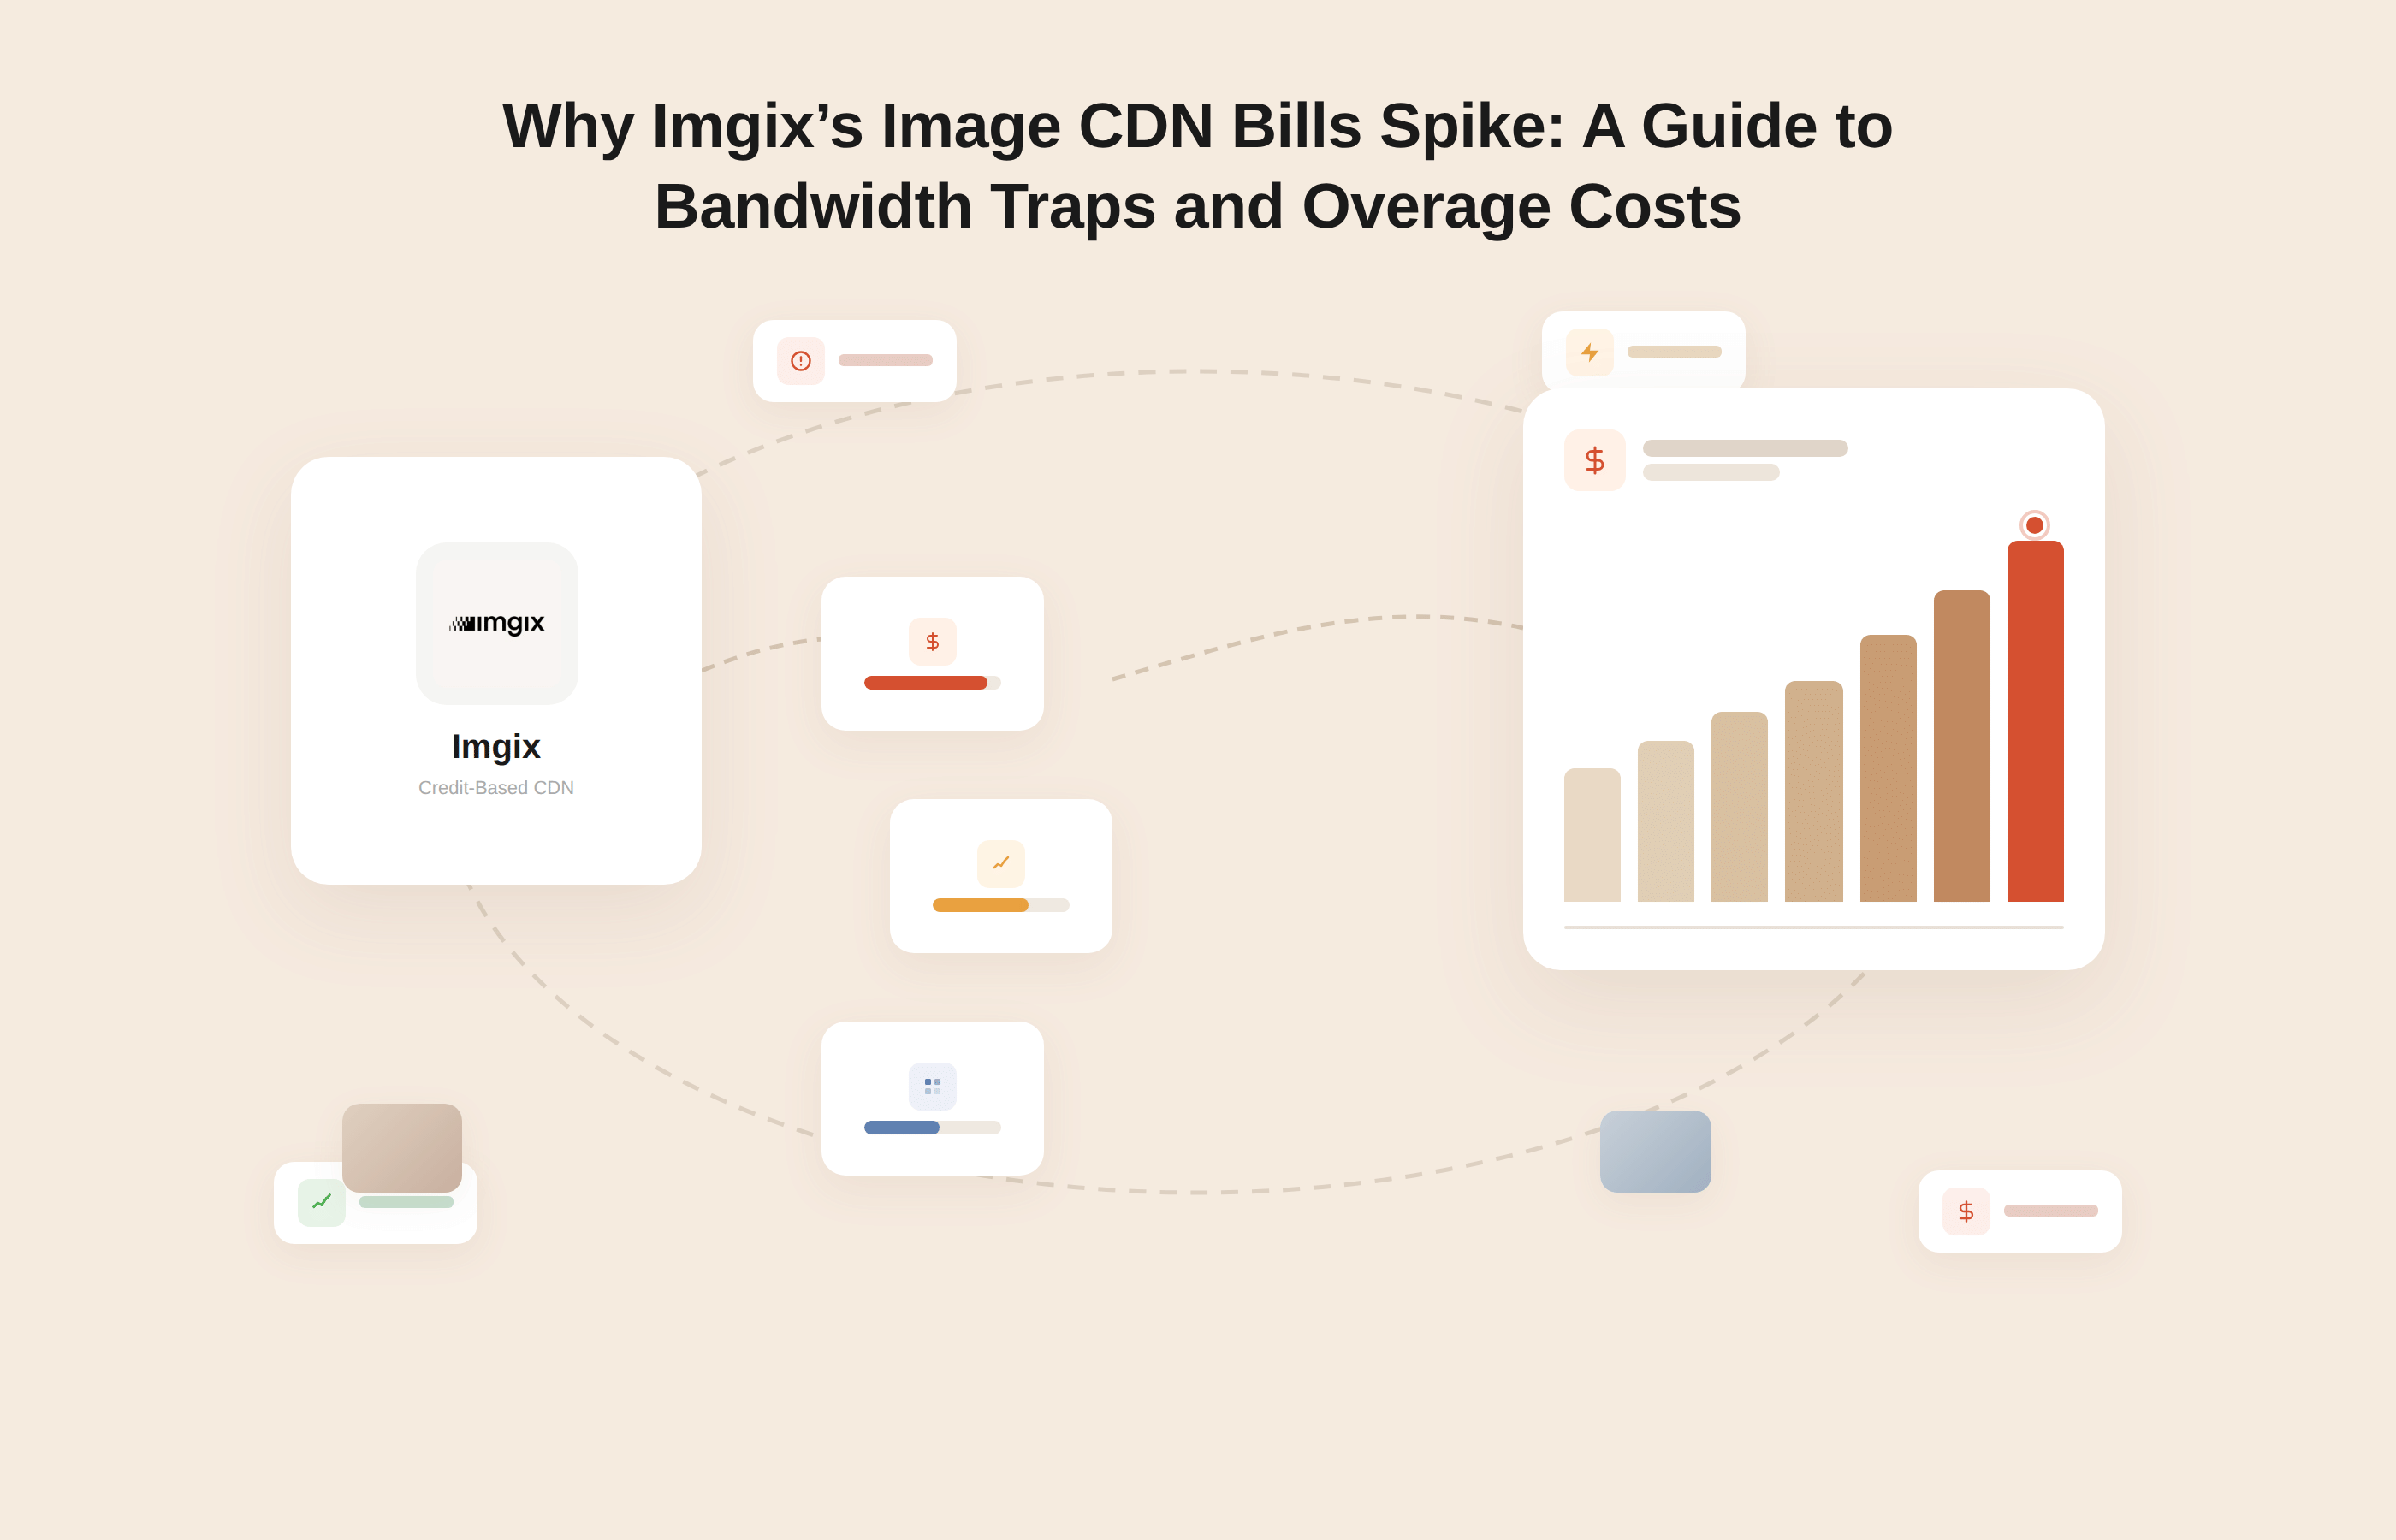
Imgix, for example, uses a credit-based billing model where bandwidth, transformations, and storage all draw from a shared prepaid pool. The analytics dashboard shows usage in credits, a unit that conflates three separate cost categories, which makes it genuinely difficult to forecast monthly spend or trace a specific configuration change to a cost outcome.
A detailed breakdown of how that model works and where the surprises tend to appear is available in the guide to Imgix's credit-based pricing model.
On bandwidth-driven platforms, transformation volume still matters because unnecessary variants inflate request count and fragment your cache. Poorly written srcset logic that generates dozens of unique transformation URLs per page is one of the most common and least-visible sources of avoidable overhead.
If you want to see how your stack measures against all four levers before making any changes, Gumlet Image Optimization offers a free tier that surfaces format distribution, cache hit rates, and per-source bandwidth from the moment your first images are served.
How to Use Your Image CDN Analytics to Identify Waste
The fastest way to find cost waste in your image delivery stack is to sort analytics by bandwidth consumed and look for sources or routes where high data transfer does not correspond to high traffic volume.
Disproportionate bandwidth per request is the clearest signal that something is delivering larger files than the experience requires, and it is a pattern that aggregate dashboards will never surface on their own.
Most teams open their CDN analytics to troubleshoot an incident or confirm that a recent deployment went cleanly. Turning the same dashboard into a weekly cost-reduction habit requires a shift in what you are looking for.
You are not looking for averages. You are looking for outliers. Here are the three most productive patterns to check first:
1. Finding High-Bandwidth, Low-Performance Routes
Sort your sources by total bandwidth consumed. Identify any source sitting in the top 20% of bandwidth but not in the top 20% of request count.
These routes are delivering disproportionately large files per request, which usually means unoptimized formats, oversized dimensions, or both. Audit the format settings and dimension configuration for those specific sources, not for your entire stack. Targeted changes to a handful of high-cost routes frequently produce the majority of total savings.
2. Spotting Unoptimized Format Opportunities
If your format distribution report shows more than 20% of requests serving JPEG to browsers that accept AVIF, automatic format negotiation either is not enabled or is not functioning correctly for that source.
This is almost always a configuration change, not an engineering project. The bandwidth savings are immediate and compound with every subsequent request served. Checking this once per quarter is a productive habit even on stacks you consider well-optimized.
3. Connecting Cache Misses to Cost Spikes
CDN analytics with time-series filtering let you correlate cache miss spikes with specific events: a product launch that introduced new image URLs, a CMS update that changed filename generation patterns, an A/B test that spawned hundreds of new transformation variants.
This connection is invisible in a billing invoice. It only becomes visible in per-request analytics. Teams that can make this connection reliably stop repeating the same expensive pattern. Teams that cannot end up investigating the same cost spike quarter-after-quarter with no clear resolution.
Key Metrics to Track in Your Image CDN Dashboard
| Metric | What It Measures | Healthy Benchmark | Cost Implication if Off |
|---|---|---|---|
| CDN Hit Rate | % of requests served from edge cache | Above 85-90% | Low hit rate increases costs |
| Format Distribution | % of traffic in WebP/AVIF vs. JPEG/PNG | 80%+ in modern formats | High JPEG share wastes bandwidth |
| Bandwidth per Source | GB delivered per origin over a period | Proportional to request volume | High bandwidth + low traffic = oversized files. |
| Transformation Count | Unique variants generated per session | Minimize unique variants | Too many variants fragment cache and increase costs. |
| Time to First Byte (TTFB) | Latency from request to first byte at edge | Under 200ms from edge cache | High cached TTFB signals CDN routing gaps |
Five Actions to Take After Reading Your Image CDN Analytics
The analytics tell you where the problem is. These five actions tell you what to do about it. They are ordered by expected impact for most sites. Format changes produce the fastest and largest gains. Cache TTL and srcset changes require more careful testing before rollout.
1. Enable Automatic Format Negotiation
If your image CDN is not automatically serving WebP to browsers that accept it, and AVIF to browsers that accept that, you are transferring more data than necessary on every single request. Format negotiation is a configuration toggle on all modern image CDNs, not a development project. It should be the first thing you verify in your dashboard.
2. Define Responsive Image Presets
Without preset breakpoints, image CDNs can generate dozens of transformation variants per page load, each as a distinct cache entry. Setting 3 to 5 defined breakpoints (320px, 640px, 1024px, and 1600px as a baseline covers most real-world use cases) reduces variant count, raises cache hit rates, and cuts unnecessary transformation overhead in a single change.
3. Raise Your Cache TTL for Stable Assets
Hero images, product images, and logos rarely change. A cache TTL of 24 to 48 hours for these assets dramatically reduces origin pull frequency. Review your analytics for URLs generating repeated cache misses and extend TTL for those routes first.
Confirm the change does not conflict with any invalidation logic in your CMS or deployment pipeline before rolling it out broadly.
4. Audit and Simplify Your srcset Breakpoints
Pull a sample of high-traffic pages and review the srcset markup. Count how many unique transformation URLs are generated per image on a typical load. If the number exceeds 8 to 10 for a standard image, you are creating cache fragmentation.
Consolidating to the five most common display widths your analytics actually show being served eliminates the overhead without changing the user experience.
5. Consolidate Orphaned Image Sources
Teams that have grown quickly often accumulate multiple CDN sources over time, set up by different teams for different product areas at different points. Per-source analytics will show you whether any of these sources have low traffic but high per-request bandwidth, usually because they were configured without format negotiation or resize rules. Bringing them under your main, well-configured source eliminates the overhead and simplifies future monitoring.
What to Look for in an Image CDN With Strong Bandwidth Analytics
An image CDN with genuinely useful bandwidth analytics exposes data at the source level, shows format distribution in real-time, surfaces your CDN hit ratio, and allows time-series filtering so you can connect cost changes to specific deployment events.
An aggregate-only dashboard showing total monthly bandwidth without breakdown is not sufficient for cost-reduction work. It tells you the outcome; it does not tell you the cause.
Analytics depth is consistently the least-discussed feature in image CDN vendor comparisons. Most evaluation attention goes to transformation quality, format support, and global CDN coverage. These matter.
But if you cannot isolate which source is driving your bill, or which format gap is costing you bandwidth every hour, you are flying blind on the dimension of image CDN management that compounds most aggressively over time.
Real-Time vs. Delayed Reporting
A reporting lag of 24 to 48 hours is acceptable for monthly budget review but is insufficient when you are diagnosing a cost spike mid-cycle.
A deployment that introduces a misconfigured image source can consume a significant portion of your monthly bandwidth allocation within two days before you even know it happened.
Real-time or near-real-time analytics let you catch configuration errors before they compound across a full billing cycle.
Source-Level and Per-URL Filtering
The minimum threshold for actionable cost visibility is the ability to filter bandwidth data by origin source. Better platforms also allow per-URL or per-route breakdown, which matters for complex sites running multiple image domains or subdomains.
This level of granularity is what makes it possible to answer "which specific images are causing this?" rather than "how much did we spend overall?"
Image CDN Analytics and Cost Visibility: Gumlet vs. Imgix vs. ImageKit
Cost visibility and analytics depth vary significantly across image CDN providers. This table compares three of the most commonly evaluated platforms specifically on their analytics capabilities and billing transparency, which is the dimension that determines whether your dashboard can actually be used as a cost-reduction tool.
| Feature | Gumlet | Imgix | ImageKit |
|---|---|---|---|
| Analytics reporting | Real-time, per-source | Available, primarily aggregate | Near real-time |
| Per-source bandwidth breakdown | Yes | Limited | Yes |
| Format distribution reporting | Yes, per source | Basic | Yes |
| CDN hit rate visibility | Yes | Limited | Yes |
| Billing model | Bandwidth-driven | Credit-based (shared pool) | Bandwidth-driven |
| Cost directly readable from analytics | Yes | No (credits ≠ bandwidth) | Yes |
| Free diagnostic tool | Yes (Gumlet Analyzer) | Yes (PageWeight tool) | Yes |
| Multi CDN delivery | Yes (Fastly + CloudFront) | Single CDN | Single CDN |
| Free tier available | Yes | Yes (30-day Trial) | Yes |
The most consequential column is "Cost directly readable from analytics." With Imgix's credit-based model, your dashboard reports usage in a shared credit unit that combines bandwidth, transformations, and storage into a single pool.
There is no direct equivalence between credits consumed and gigabytes delivered, which means you cannot look at your analytics and produce a reliable cost forecast without working backward through a credit-to-dollar calculation that changes as your transformation mix changes.
Gumlet and ImageKit both use bandwidth-driven pricing, which means the analytics and the invoice are denominated in the same unit. You can look at per-source bandwidth numbers, apply your rate, and arrive at a forecast in a single step.
For engineering teams under quarterly pressure to justify infrastructure spend or identify reduction opportunities, that transparency removes a meaningful layer of friction.
For teams actively considering a migration away from Imgix, the Gumlet Imgix alternative page covers the switching case in full, including parameter mapping, migration steps, and cost comparison methodology.
Note: Feature availability across platforms changes with product updates. Verify current capabilities with each vendor before making a final evaluation decision.
How Gumlet Surfaces Bandwidth and Delivery Analytics
Gumlet is an image optimization and delivery platform that exposes source-level bandwidth analytics, format distribution reports, and CDN hit rate data through its dashboard, making it possible to connect image delivery decisions directly to cost outcomes.
Unlike credit-based image CDN billing models that create a translation layer between usage and spend, Gumlet's pricing is bandwidth-driven, which means the dashboard and the budget tool are the same thing.
In practice, Gumlet's analytics are organized around Sources, each corresponding to a connected origin (AWS S3, GCS, Cloudflare R2, or any HTTP origin). Within each source view, you can see bandwidth consumed, format distribution, cache hit rate, and request volume over any selected time window. When a cost spike appears, this structure lets you isolate it to a specific origin in seconds rather than working backward from an aggregate monthly figure.
In practice, the diagnostic workflow looks like this
- A team notices a CDN cost spike mid-month.
- They open the Gumlet dashboard and navigate to the Sources view.
- Within that view, sorting by bandwidth consumed surfaces the specific origin that spiked.
- Clicking into that source shows format distribution. If the spike is accompanied by a drop in AVIF/WebP delivery percentage, a recent deployment likely changed how that origin's images are being requested. If format distribution is stable but bandwidth is high, the investigation moves to cache hit rate for that source.
- A hit rate drop in the same time window points to new transformation variants fragmenting the cache.
From identification to root cause, this workflow typically takes under ten minutes, compared to the multi-hour investigation that aggregate-only billing dashboards require.
Gumlet automatically enables format negotiation for WebP and AVIF across all sources, which means the format distribution report shows not just what is being served, but how much of your traffic is benefiting from next-generation compression.
This is a direct outcome of automated format conversion, responsive resizing, and multi-CDN caching delivered through Fastly with CloudFront as a regional fallback.
Where Imgix's credit-based model conflates bandwidth, transformations, and storage into a single opaque pool (making spend forecasting genuinely difficult as usage patterns become more complex), Gumlet keeps the relationship between delivery and cost straightforward.
You see how many gigabytes a source consumed, you know your per-GB rate, and you produce a forecast in one calculation. For infrastructure teams being asked to justify and reduce cloud spend in quarterly reviews, that directness is not a minor convenience.
Independent review platforms reflect this advantage. On SaaSworthy, Gumlet holds a rating of 4.8 out of 5 across 227 ratings (as of March 2026), with users consistently highlighting dashboard clarity, CDN routing performance, and cost predictability.
User reviews on G2 consistently reference cost reduction outcomes and dashboard clarity as primary reasons for switching.
For teams with larger deployment questions or those planning a migration from an existing platform, Gumlet offers a scheduled demo with their solutions team.
For a direct pricing model before committing, Gumlet's image pricing is structured around bandwidth and projects, with no shared credit pool.
Frequently Asked Questions
1. What metrics should I check in my image CDN analytics to reduce costs?
Focus on four metrics: CDN hit rate, format distribution, bandwidth per source, and transformation volume. These correspond directly to the Four Cost Levers of Image Delivery. A hit rate below 85% means you are over-relying on origin pulls. High JPEG percentages in format distribution suggest automatic format negotiation is not fully active. High bandwidth on a low-traffic source typically points to oversized images or a missing resize configuration.
2. How much can switching to AVIF or WebP actually reduce CDN bandwidth costs?
Switching from JPEG to AVIF can reduce file sizes by 40 to 60% at comparable visual quality, based on benchmarks published by the Alliance for Open Media and validated in Google's own documentation. WebP typically delivers 25 to 35% savings over JPEG. For a site serving 50 GB of images monthly, full AVIF adoption could reduce that to 20-30 GB. That reduction scales linearly against your per-GB CDN rate, making format efficiency the highest-leverage lever for most teams.
3. Does Gumlet show bandwidth analytics broken down by image source?
Yes. Gumlet's dashboard organizes data by Source, where each Source corresponds to a connected origin. You can view bandwidth consumed, format distribution, and cache hit rate per source across any selected time period. This makes it straightforward to identify which specific origins are driving delivery spend and which are already well-optimized, without inferring from aggregate totals.
4. Why does Imgix's credit model make cost tracking harder than a bandwidth-based model?
Imgix uses a unified credit pool where bandwidth, transformations, and storage all draw from the same prepaid balance. Credits do not translate to gigabytes or dollars in a one-to-one relationship, which means the analytics dashboard shows credit consumption rather than a figure you can directly map to a bill. Teams frequently report that Imgix spend becomes progressively harder to forecast as usage complexity grows, particularly after AVIF rollouts or responsive image changes that generate new transformation variants at higher volumes.
5. Is there a free way to audit my current image delivery performance before switching CDNs?
Yes. Gumlet offers a free diagnostic tool at gumlet.com/analyzer that audits your current image delivery for format compliance, compression levels, display-size accuracy, and lazy-load coverage. Running it against your key pages before any migration gives you a concrete baseline to measure against post-switch. It requires no account and produces results in under a minute.
Conclusion
Image CDNs with bandwidth analytics reduce delivery costs when the analytics are granular enough to act on. The metrics that matter are CDN hit rate (target above 85%), format distribution (80% or more of traffic in WebP or AVIF), bandwidth per source (outliers indicate oversized or unoptimized files), and transformation count (excess variants fragment cache and inflate request volume).
Platforms that report these metrics per origin source, in the same bandwidth unit as the invoice, allow engineering teams to connect configuration changes directly to cost outcomes. Platforms that report only aggregate monthly totals do not.
Most teams with monthly visitor counts above 50,000 can reduce image delivery costs by 30% or more by acting on per-source analytics data alone, without migrating their image pipeline or rebuilding their asset workflow.